I have been interested in learning the constellations and memorizing the locations of stars in the sky, however getting this instruction from other people or from written sources has been challenging - conversations with someone who already knows the constellations might sound like "see that bright star over there - and right next to it is this other star - and below that is the rest of the constellation". I would be left questioning whether I was looking at the same stars that were being described; most likely I was, but it might be the case that I was not. As a beginner, without any confident reference points in the sky, I would have trouble extending my observations using a sky map, due to the doubt over the accuracy of my initial observations. This article seeks to address the issue by providing printable maps of some easily observed constellations, which are scaled such that they appear "life-sized" and may be directly compared to the visible sky, removing all doubts as to whether one is looking at the correct stars.
The challenge in describing a constellation is expressing relative 3D angles between stars. If the eye of the observer is assumed to be located at a point, the light from the stars may be considered as 3D lines passing through that point, with each star described by a unique angle. Instead of looking at the stars, one may look at a piece of paper, and different locations on that piece of paper will also direct light in lines passing through the observation point. If the distance and angle of the paper relative to the eye is controlled, then it is possible to print a pattern such that it appears to be of a similar visual size and shape as what the eye sees when looking at distant objects. With the pattern printed on a transparent sheet, it may even be possible to overlay the printed and actual objects directly in the visual field.
The idea is related to work in the Size of Clouds article, where a printed circular projection was suggested as a tool to visually measure solid angles. Here a different projection is used to allow larger constellations to be shown accurately, where it is assumed that the printed pattern (on paper or transparent sheet) is held out at arms' length, and the paper's normal axis passing through the center of the pattern is pointing towards the eye. Therefore the projection is from spherical coordinates describing the stars in 3D space to rectangular coordinates describing their apparent locations on a piece of paper held in front of the observer.
For the star locations, I used data from Atlas of the Universe - The Brightest Stars (text version mirrored here) and from Alcyone Software - Bright Star Catalogue. These sources provide star names, grouping by constellation, and for each star the values of Right Ascension (RA) and Declination (D) of the equatorial coordinate system.
The star data for some prominent constellations is formatted in a tab-separated table (download here) for easier import to mathematical processing software (scilab). The RA and D are converted to a 3D unit vector (xs,ys,zs). A 3D plot may be made of these unit vectors (scilab script file), giving an "external view" of the celestial sphere.
[ xs ]   [ cos(RA) * cos(D) ]
[ ys ] = [ sin(RA) * cos(D) ]
[ zs ]   [ sin(D)           ]
This vector is referenced to equatorial coordinates. The origin is the observation point (the location of the eye). Next the orientation of the observer is defined as a 3D coordinate system that is rotated by 3 Euler angles (ea,eb,ec). This allows us to define the location of the virtual piece of paper (2D plane) to minimize the distortion for a particular constellation of interest. The first angle rotates about the z axis, the second about the x axis, the third about the z axis again. The rotation matrix is further discussed on wikipedia.
       [ cos(ea)*cos(ec)-cos(eb)*sin(ea)*sin(ec), -cos(ea)*sin(ec)-cos(eb)*cos(ec)*sin(ea), sin(ea)*sin(eb)  ]
rmat = [ cos(ec)*sin(ea)+cos(ea)*cos(eb)*sin(ec), cos(ea)*cos(eb)*cos(ec)-sin(ea)*sin(ec),  -cos(ea)*sin(eb) ]
       [ sin(eb)*sin(ec),                         cos(ec)*sin(eb),                          cos(eb)          ]
Three orthogonal unit vectors, defining the forward, right, and up directions for the observer, are then rotated by rmat.
view_dir = rmat * view_dir
rt_dir = rmat * rt_dir
up_dir = rmat * up_dir
The line of the starlight is defined parametrically using t:
[ x ]       [ xs ]
[ y ] = t * [ ys ]
[ z ]       [ zs ]
We need to find t describing the intersection of the above line with the paper plane. This plane is defined by the in-plane vectors (rt_dir, up_dir), and is shifted from the origin along view_dir by a scalar view_offset. Since the dot product of any in-plane vector with the plane normal view_dir is zero, we obtain the following equation:
(     [ xs ]                 [          ] )    [          ]
( t * [ ys ] - view_offset * [ view_dir ] ) .* [ view_dir ] = 0
(     [ zs ]                 [          ] )    [          ]
This is solved for t which is the point on the line of starlight projected onto the paper plane. Then the dot products of this point with the unit vectors (rt_dir, up_dir) give the 2D projected coordinates (px, py) along the paper x and y axes (scilab script file).
I completed the projections for the constellations Cassiopeia, Ursae Majoris, Ursae Minoris, Corona Borealis, Cygnus, Aquila, Pegasus (and Great Square, which is 3 stars from Pegasus and 1 from Andromeda). The maps are to be used in this manner: after printing, the sheet of paper (or transparency) is to be held with both arms outstretched in front of the observer, and then adjusted to be positioned visually next to the stars of interest. Looking with one eye at the center of the map, the observer should get a similar impression of the star locations as when looking at the sky. With a transparency, the map may even be overlaid on the apparent points of starlight.
The map projections were calculated with a view distance (view_offset) of 640 mm, which is the distance I measured from my eye to my fingertips when holding a piece of paper with arms fully extended. The map images are sized to just fit inside a paper sheet that is 11 inches by 8.5 inches (margins may not print completely on the larger constellations, depending on your printer). To use these maps with another view distance, simply scale the size of the image to the same ratio as that of the view distances. Each map has a small X symbol in the center, and another one below the center. These are meant to confirm the size of the map after printing; the measured length between the Xs should be the actual view distance divided by 10.
For each of the constellations, there are two versions, one with unlabeled circles representing the stars, and one with the circles labeled by Greek letters to identify each star. The circles were plotted using Desmos graphing calculator. The raw (px, py) coordinates used in these maps may be downloaded here.

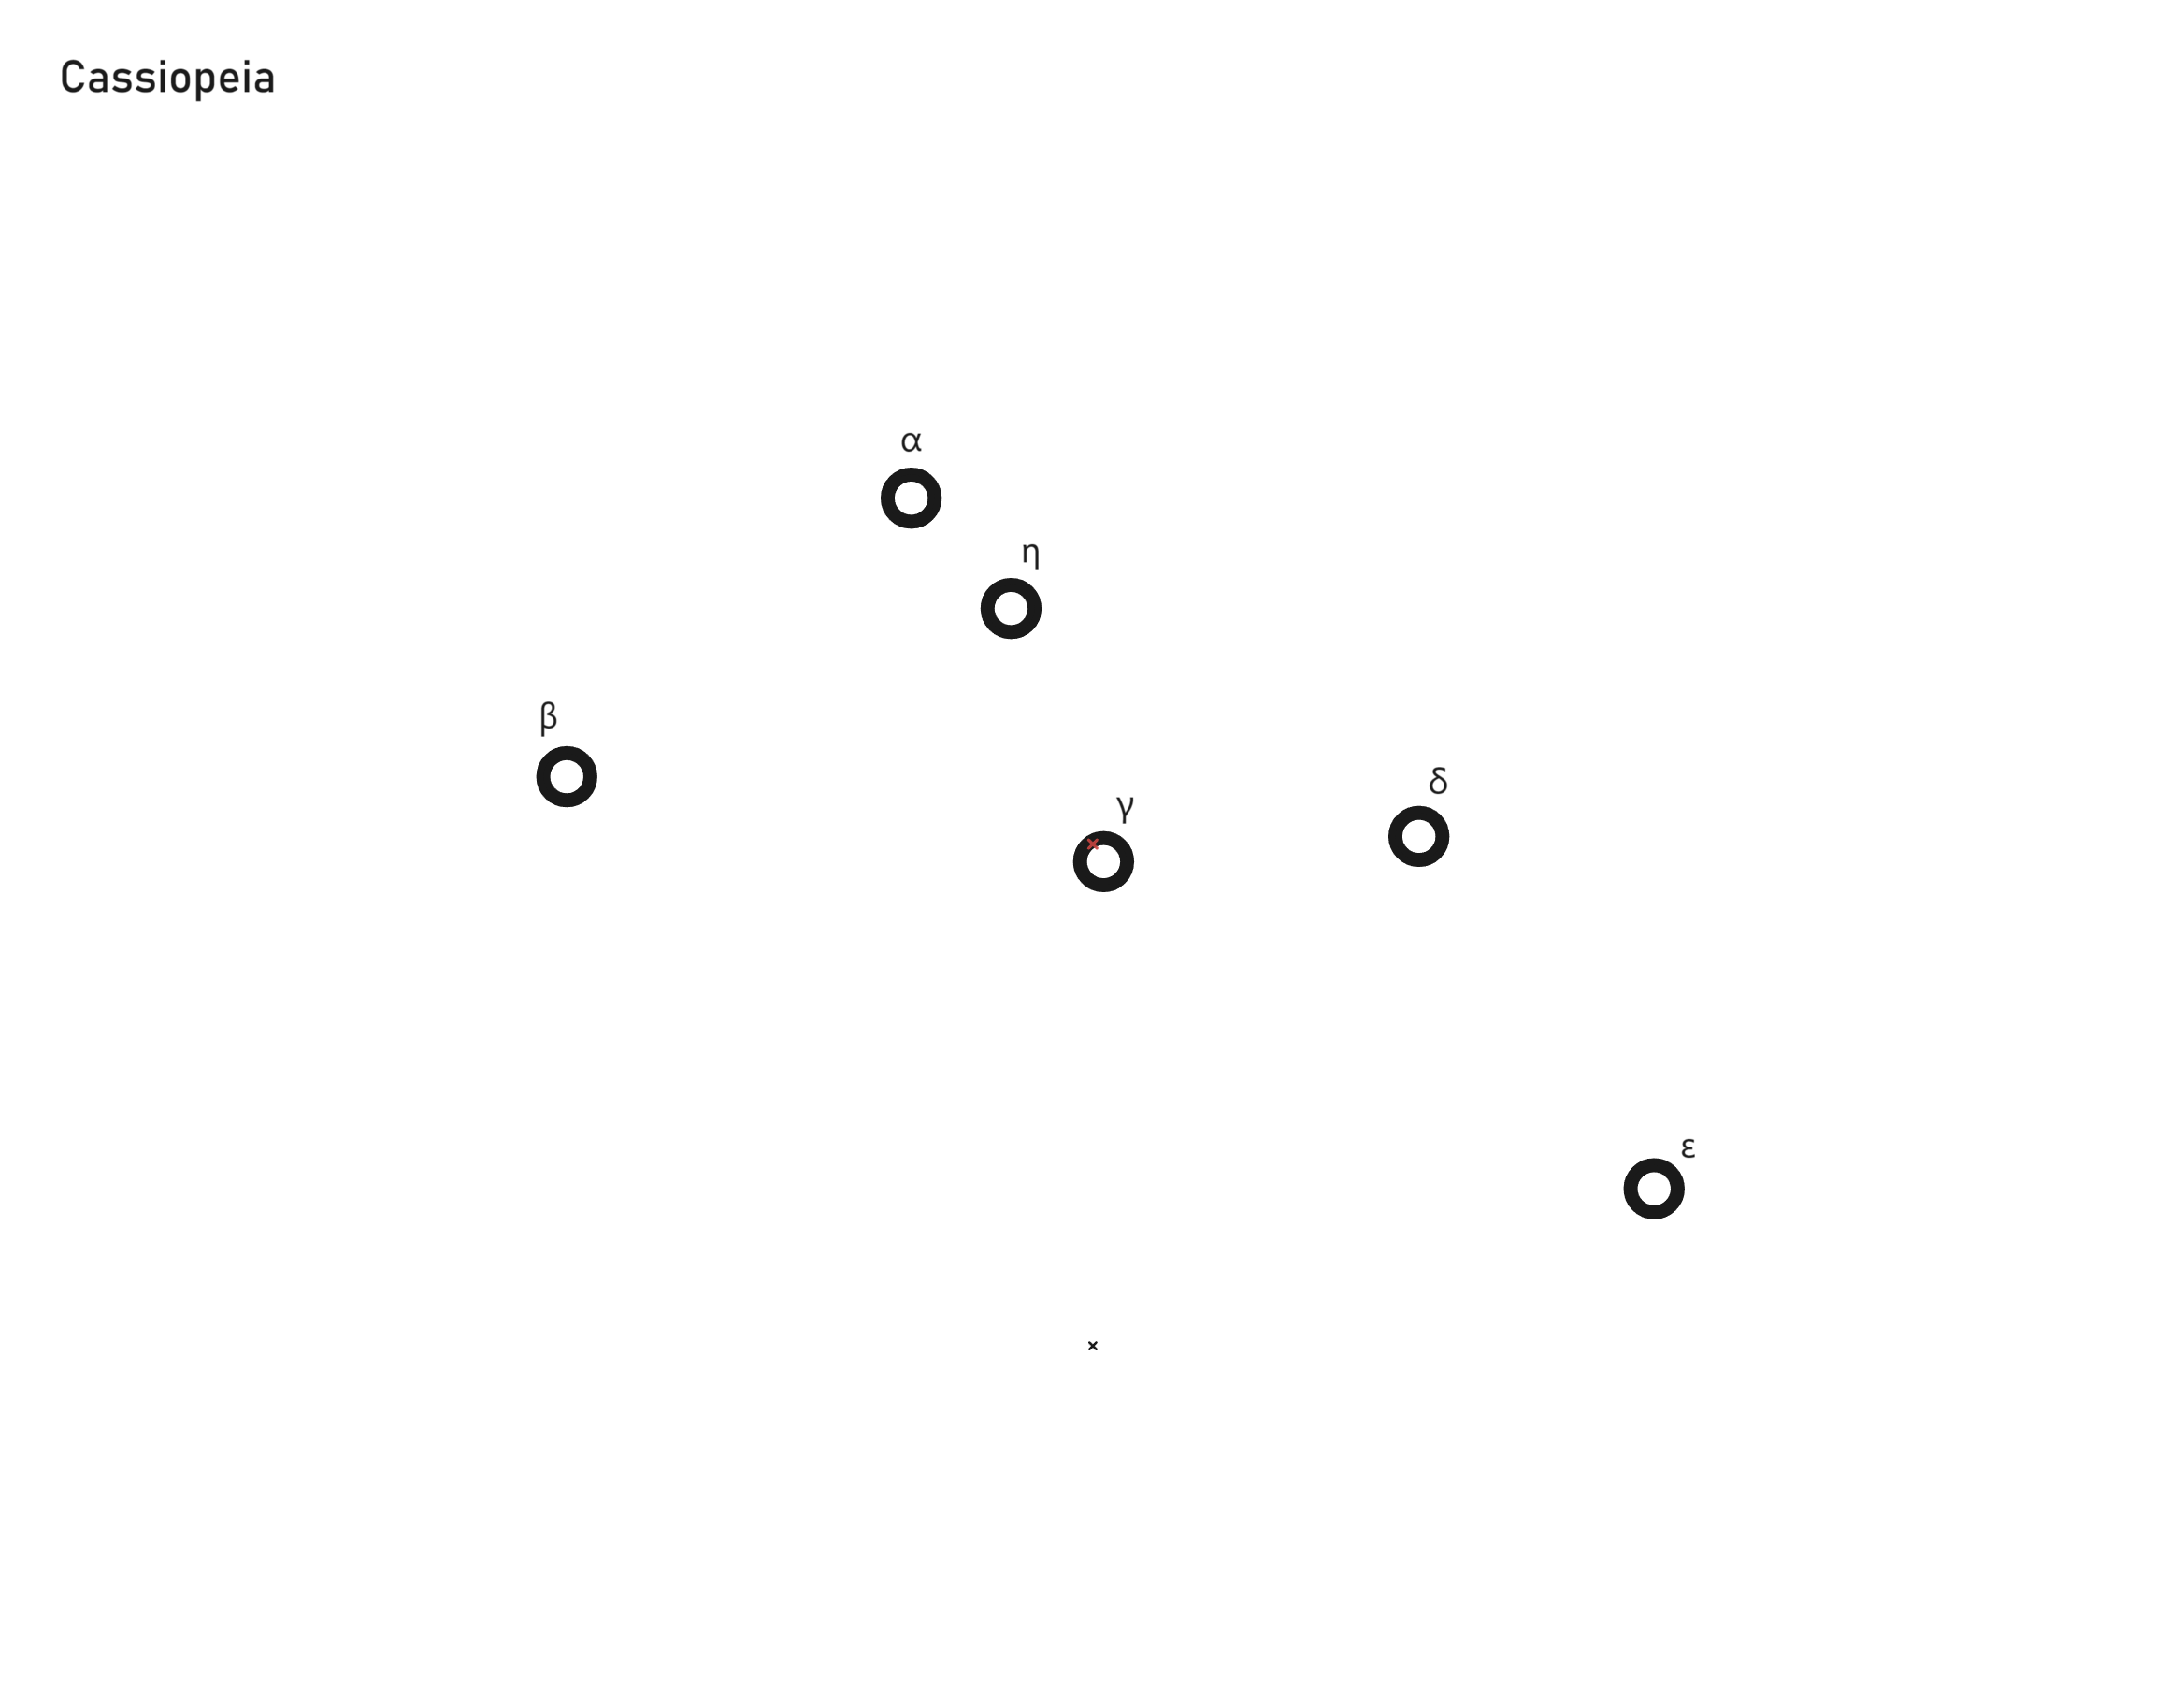
Cassiopeia constellation, unlabeled (left), labeled (right).
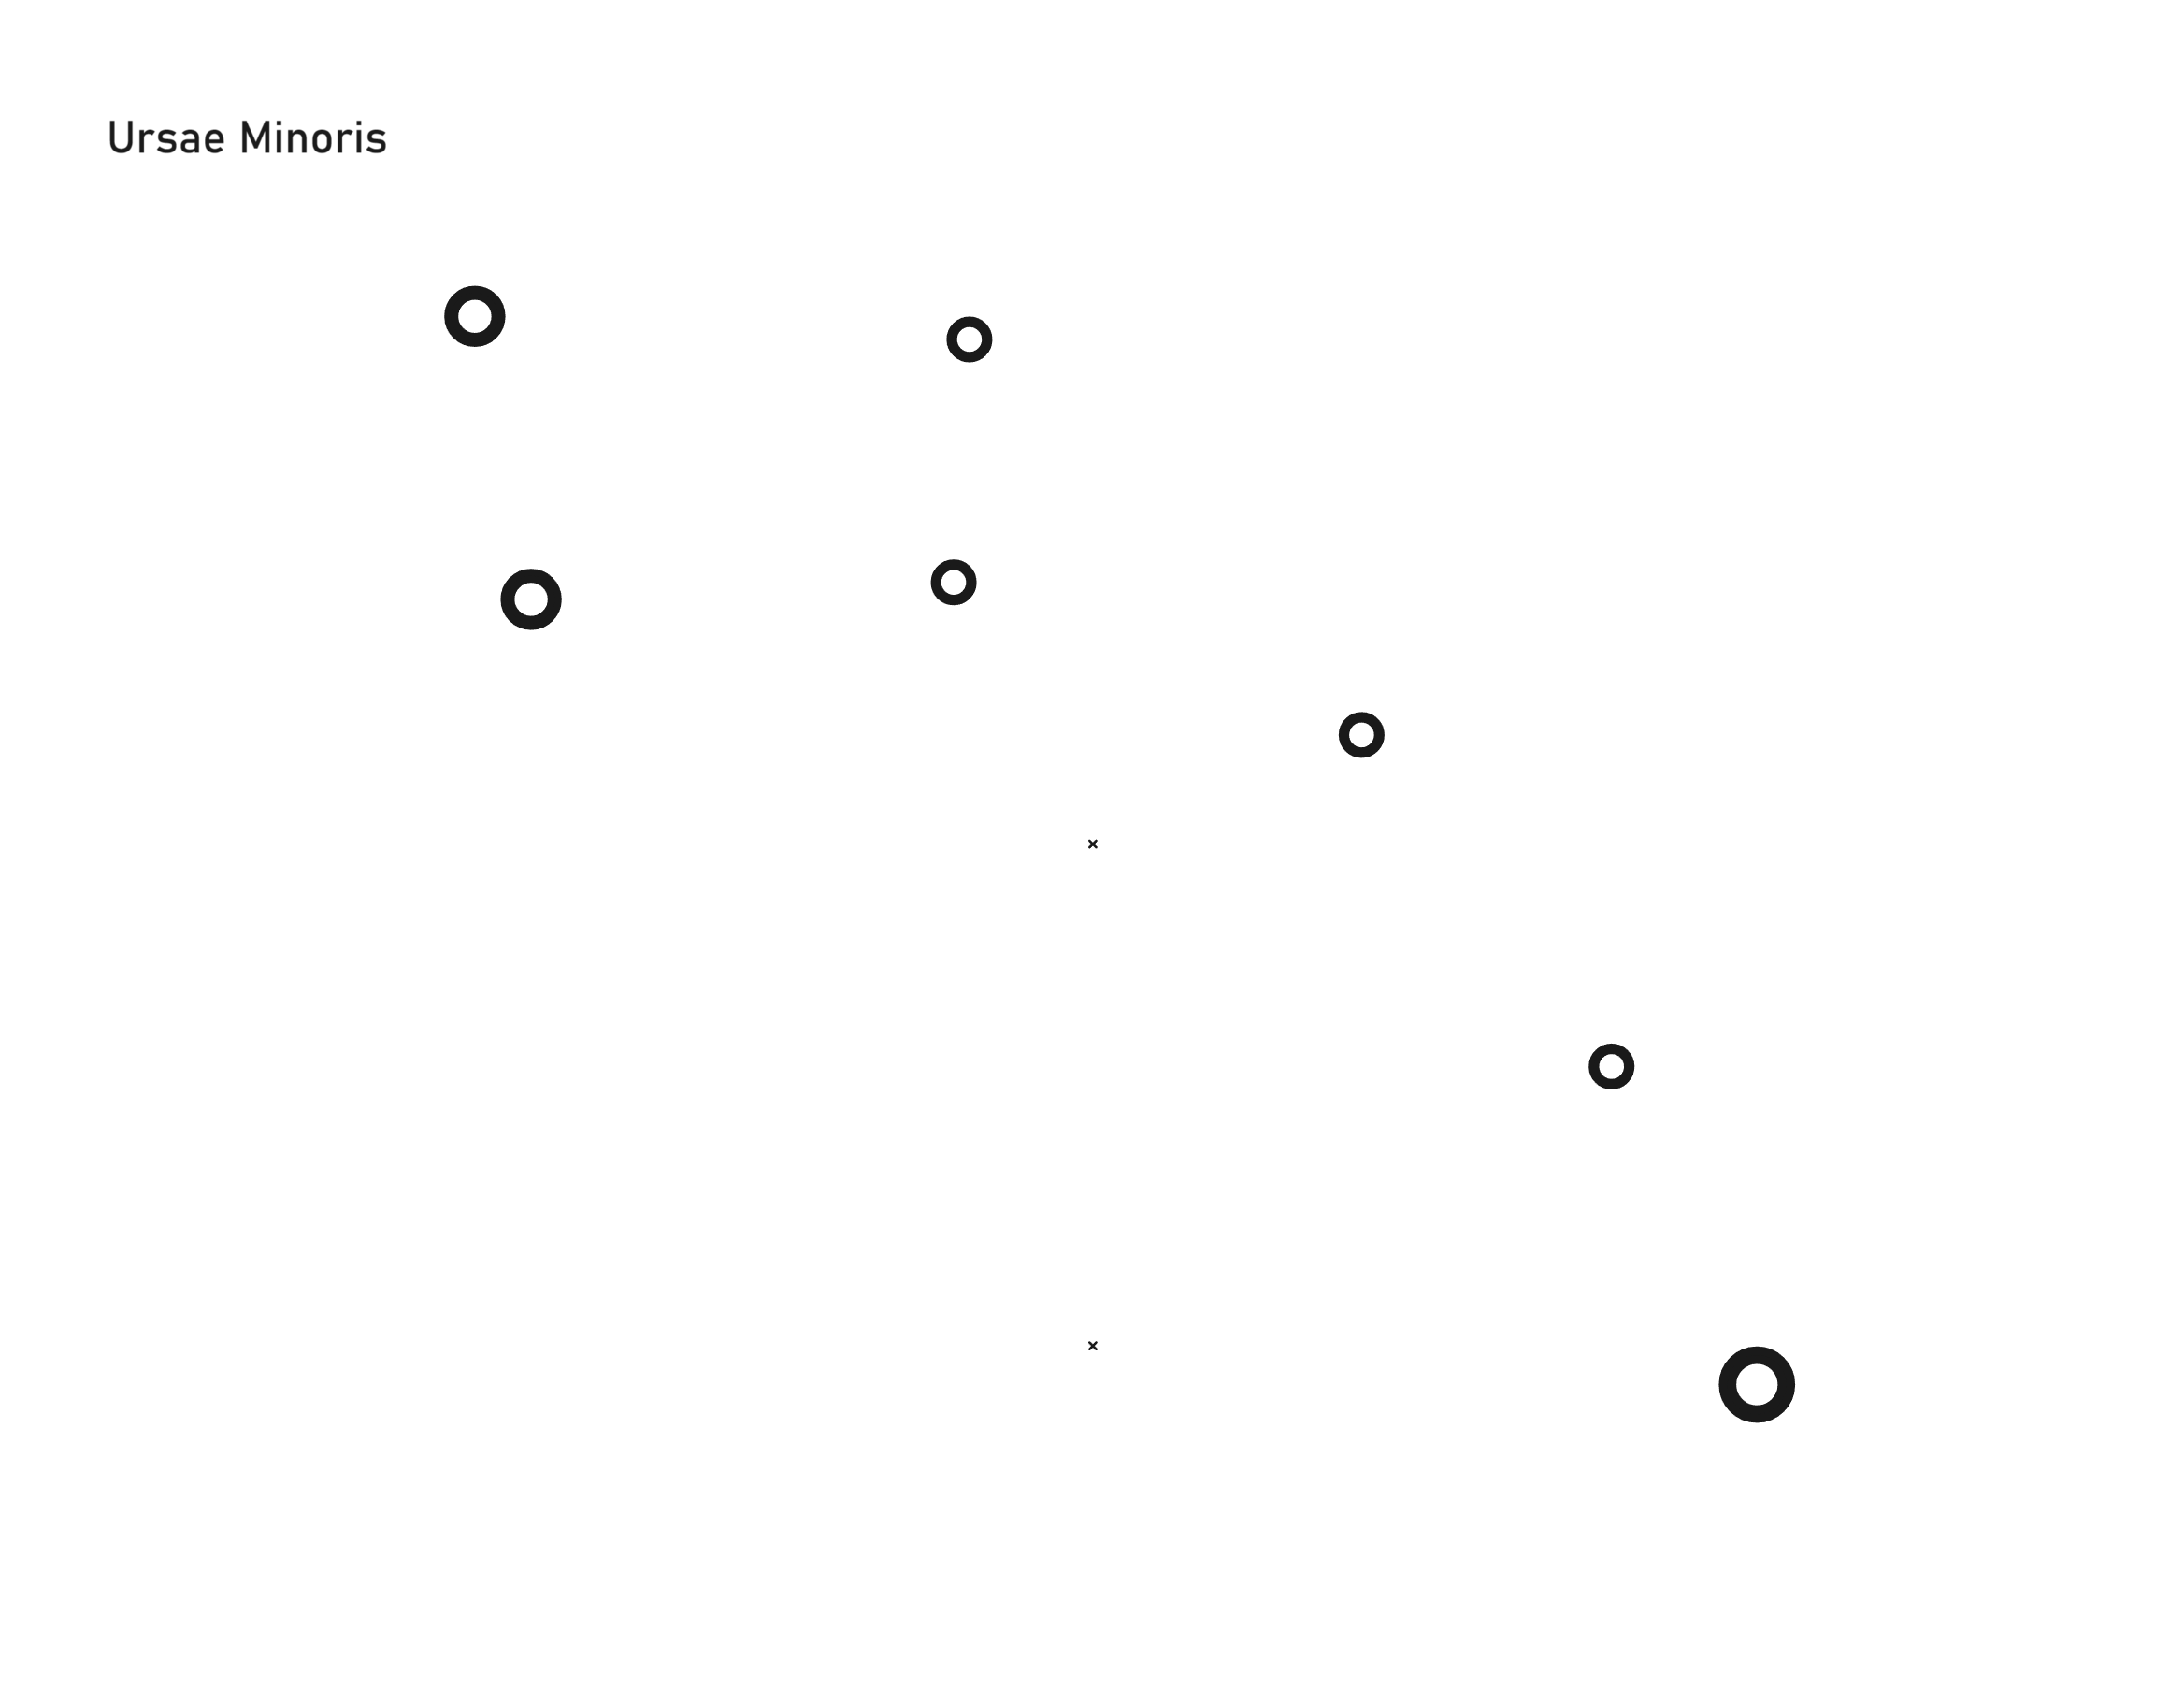

Ursae Minoris constellation, unlabeled (left), labeled (right).
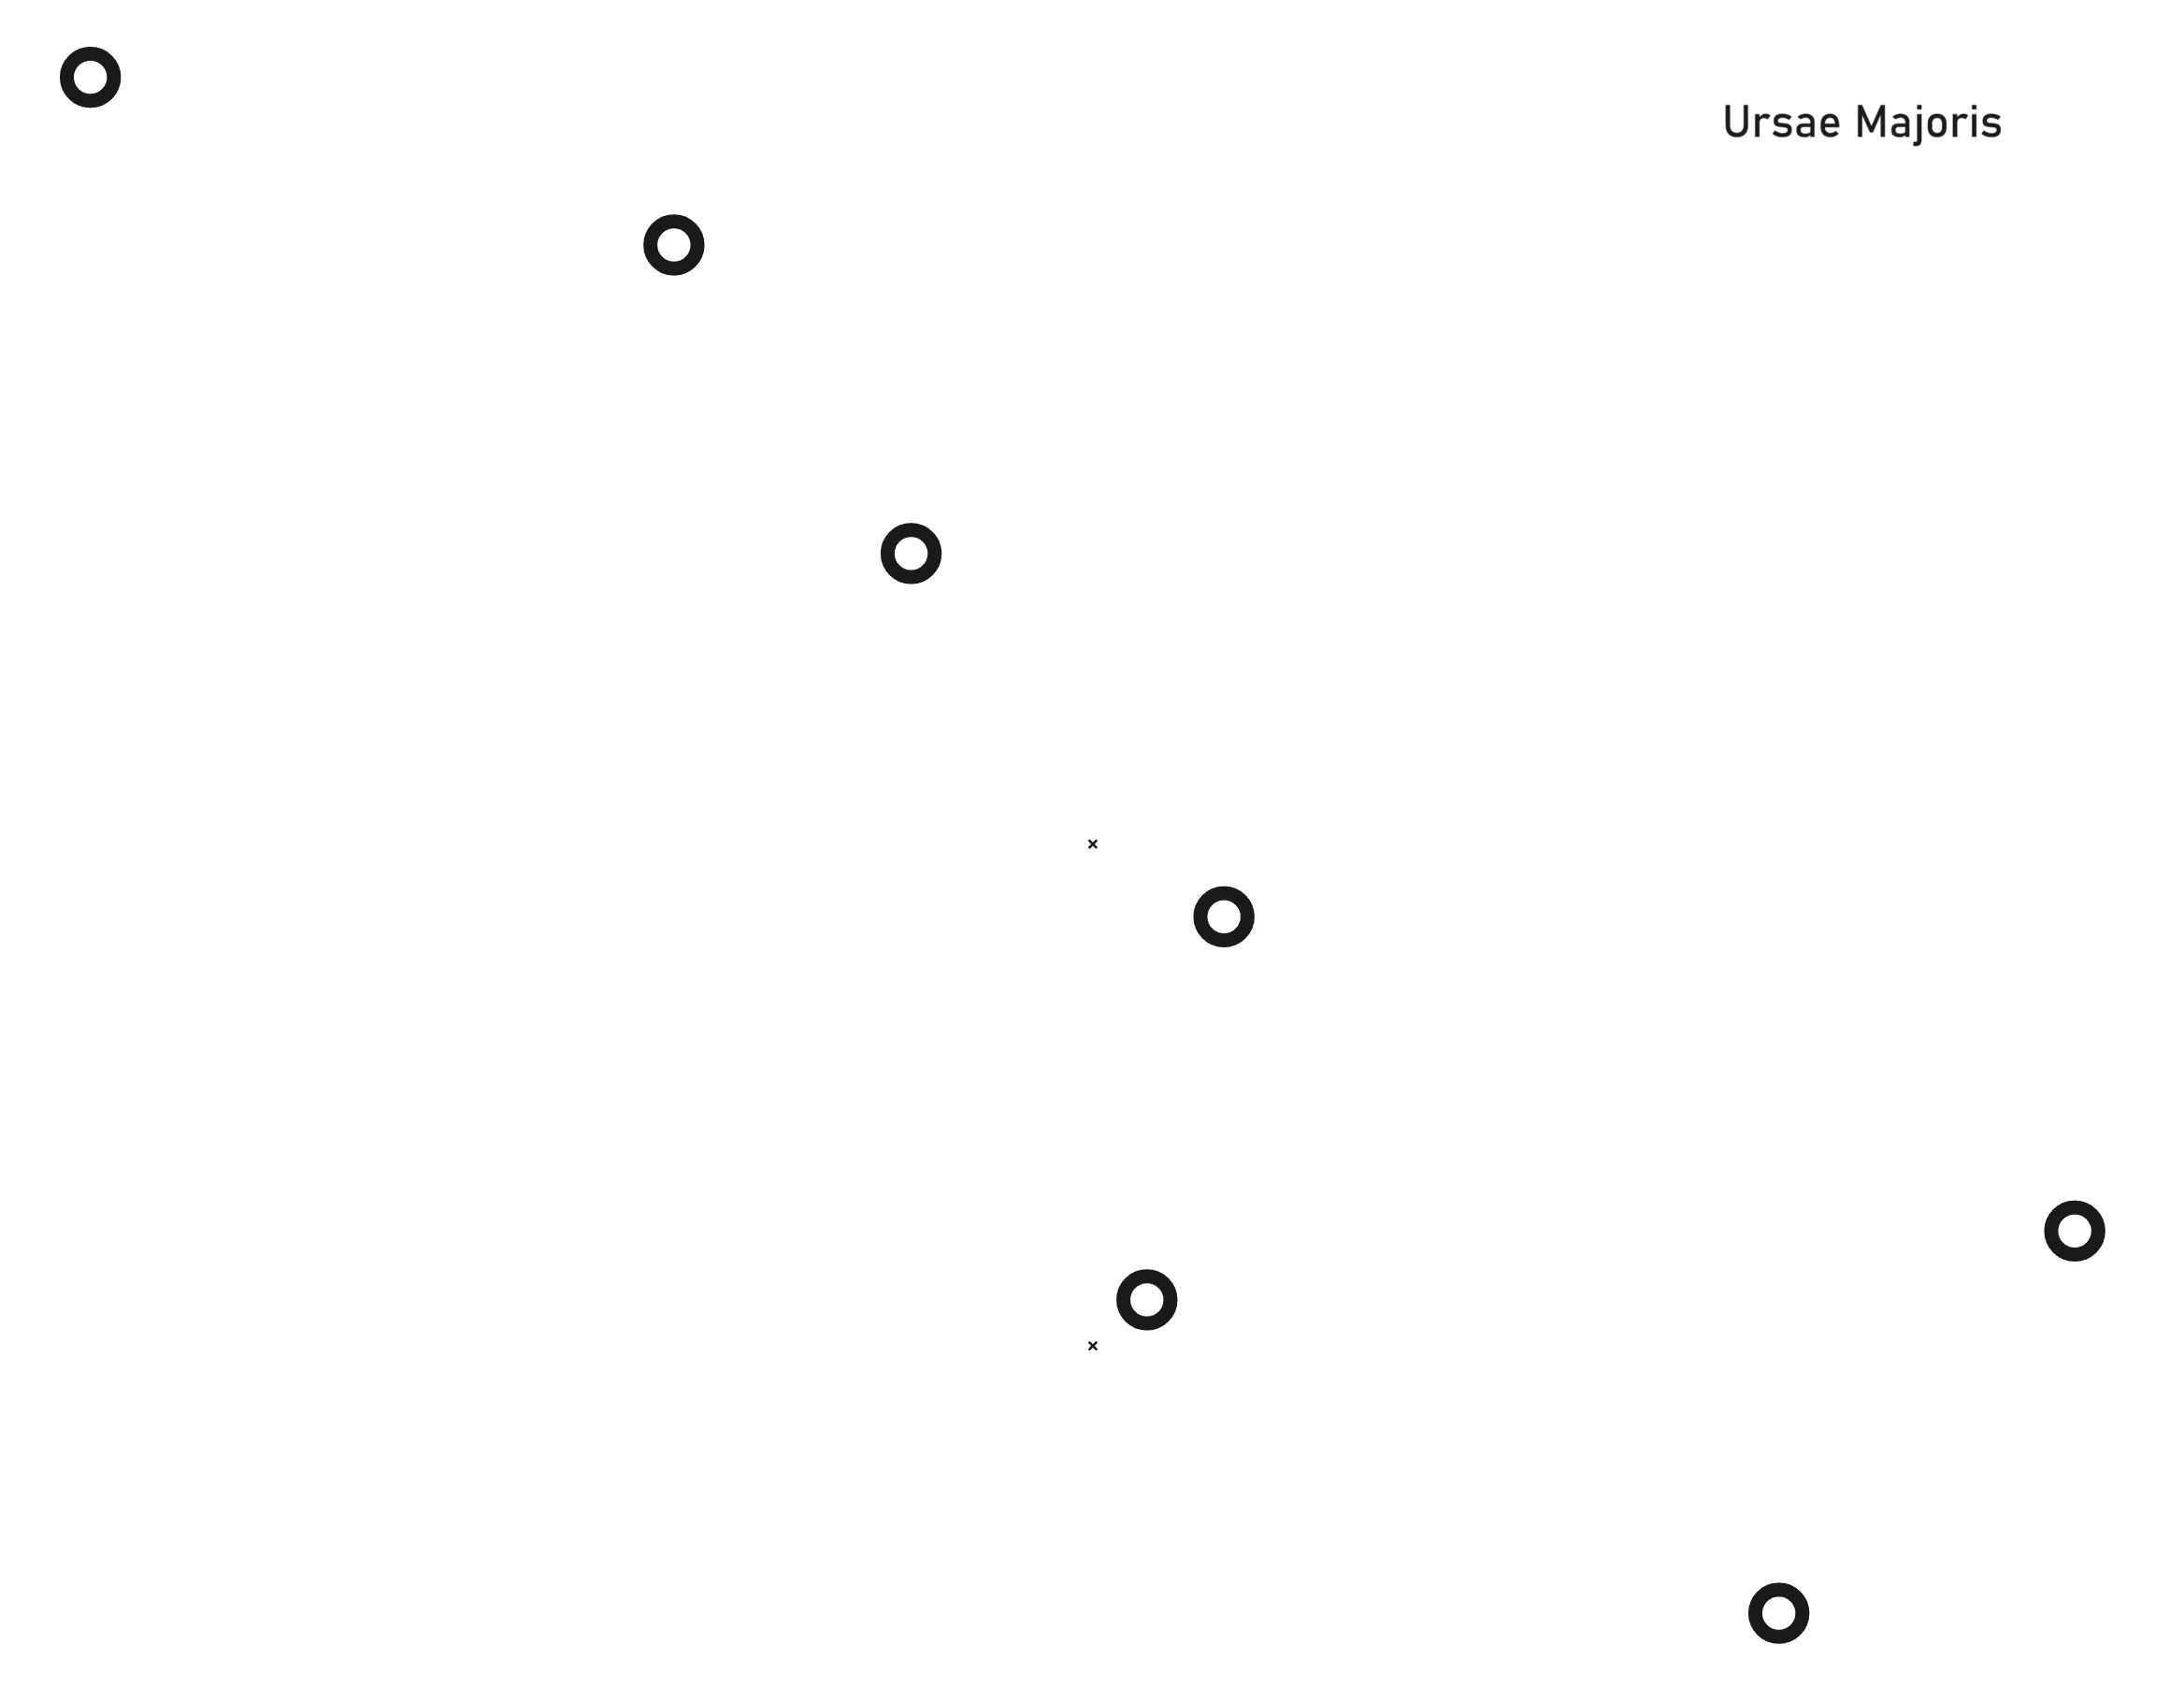

Ursae Majoris constellation, unlabeled (left), labeled (right).
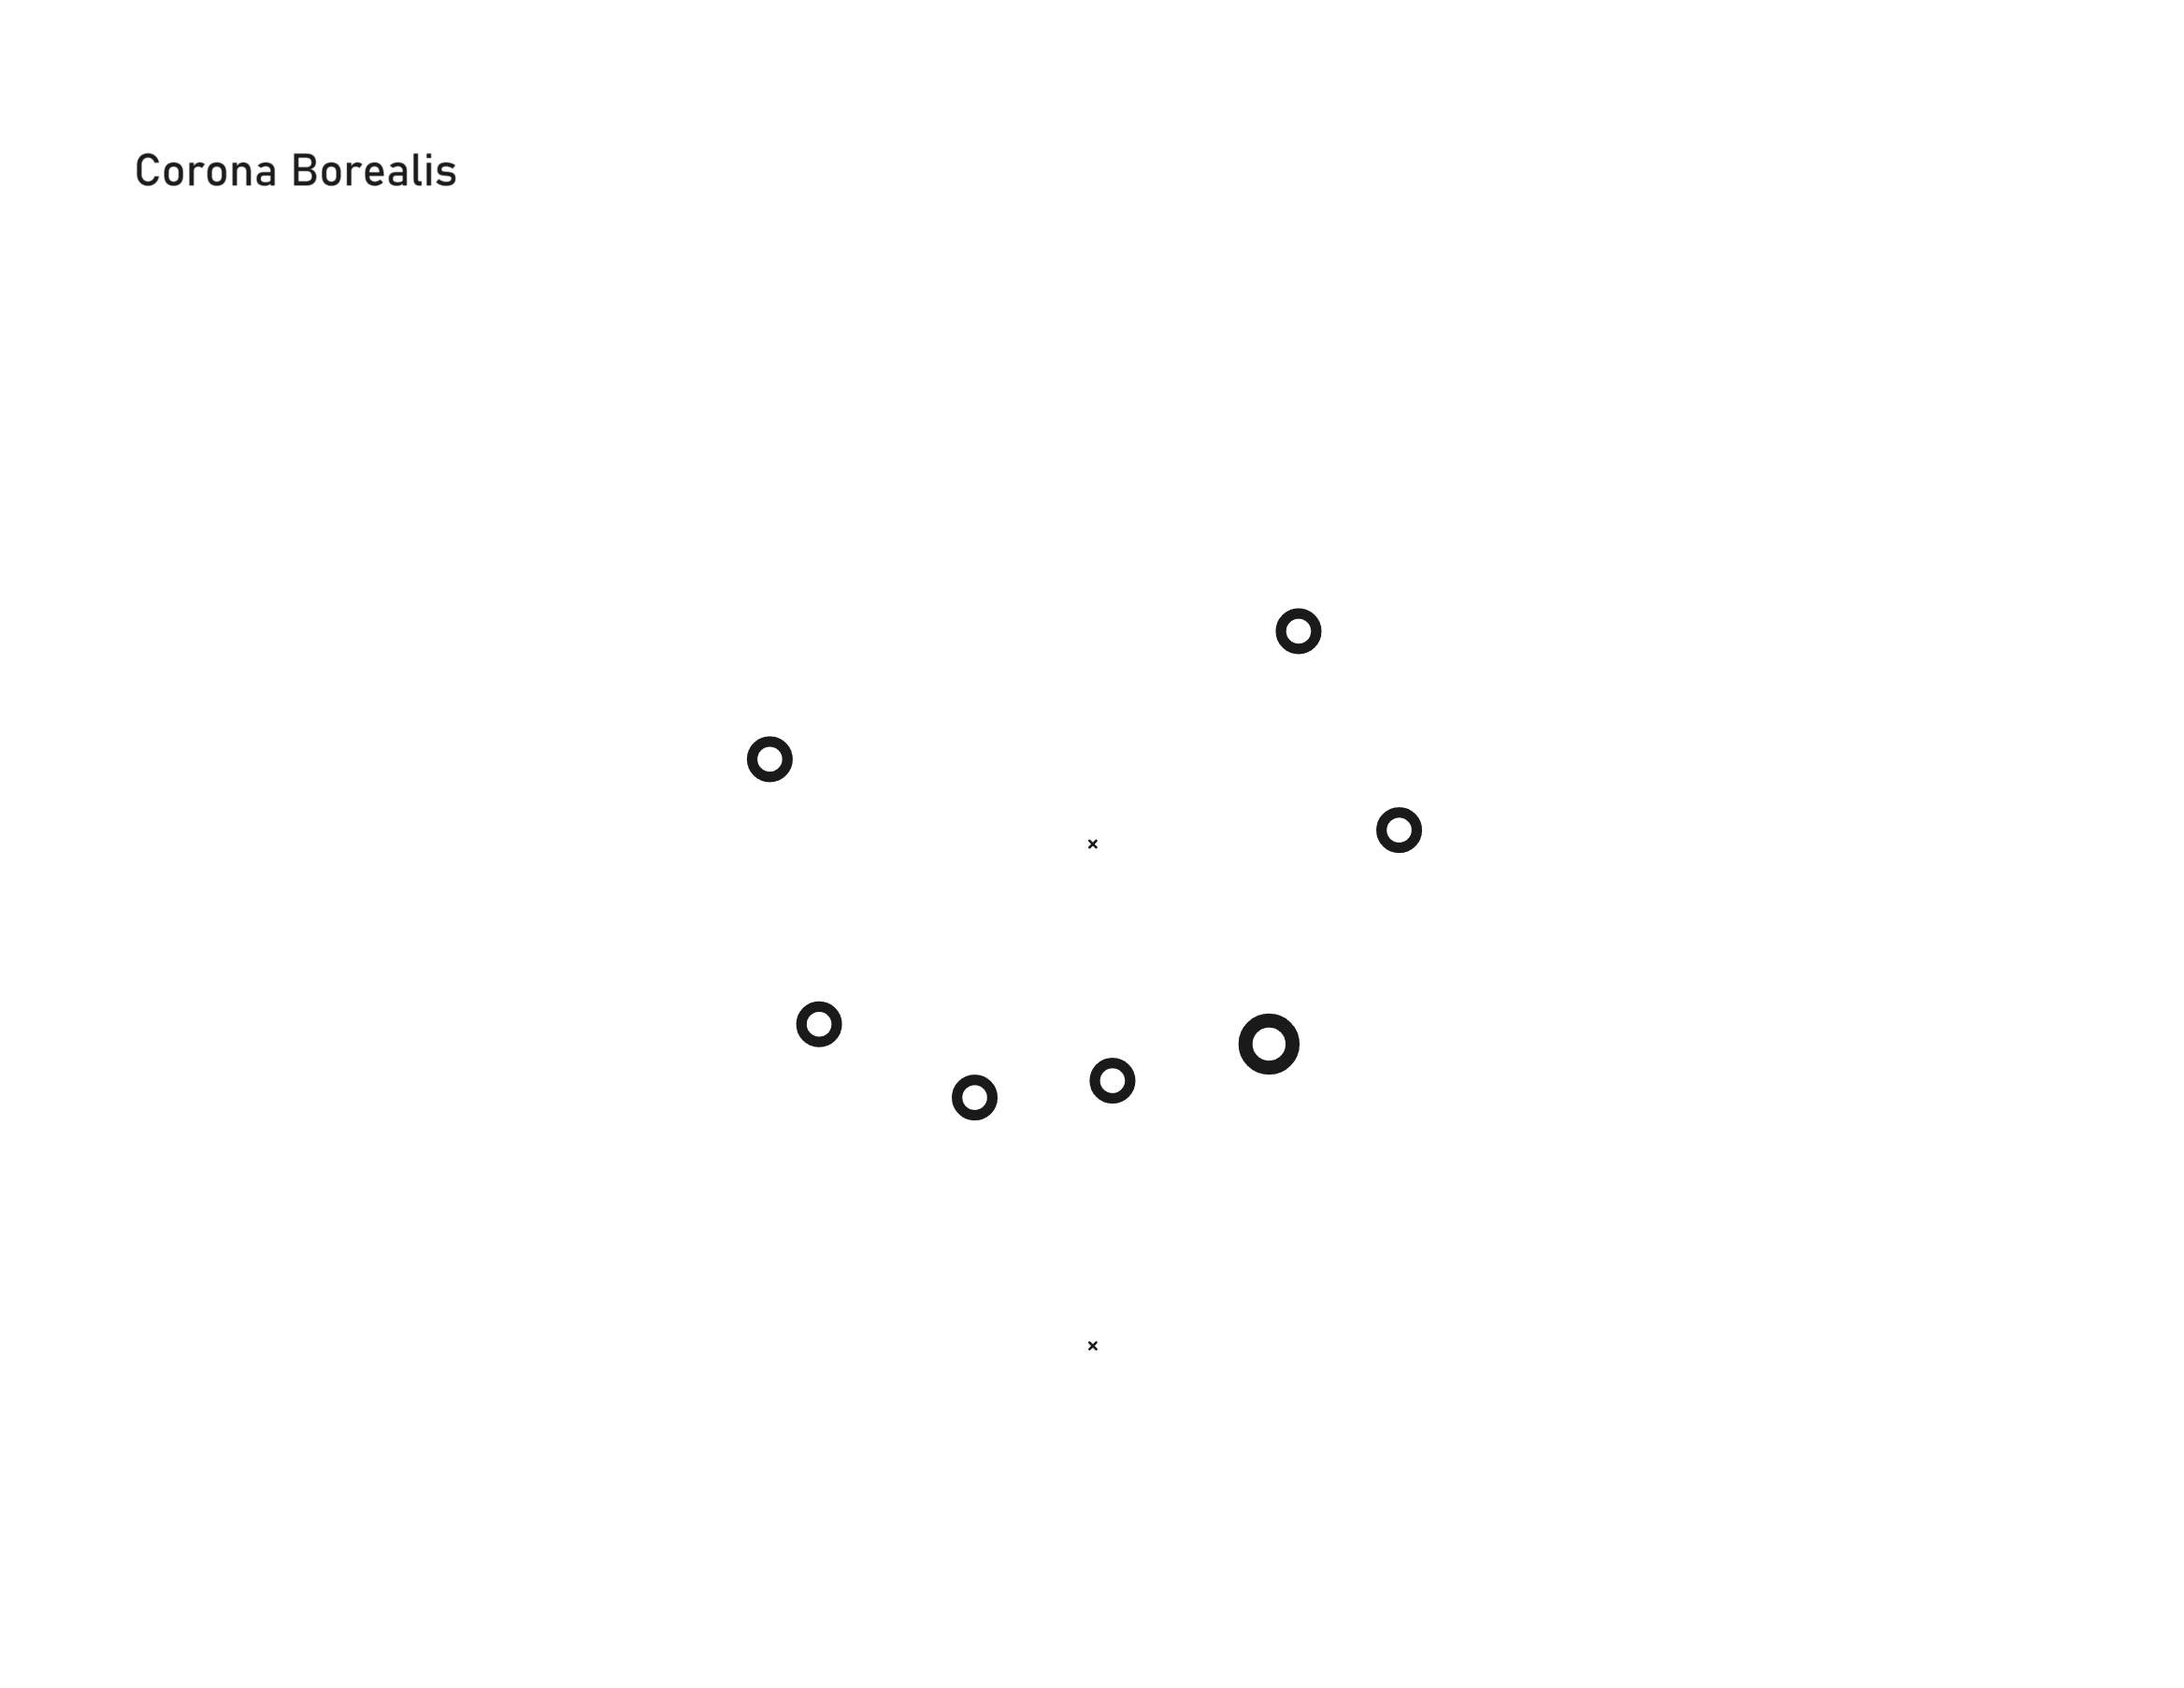
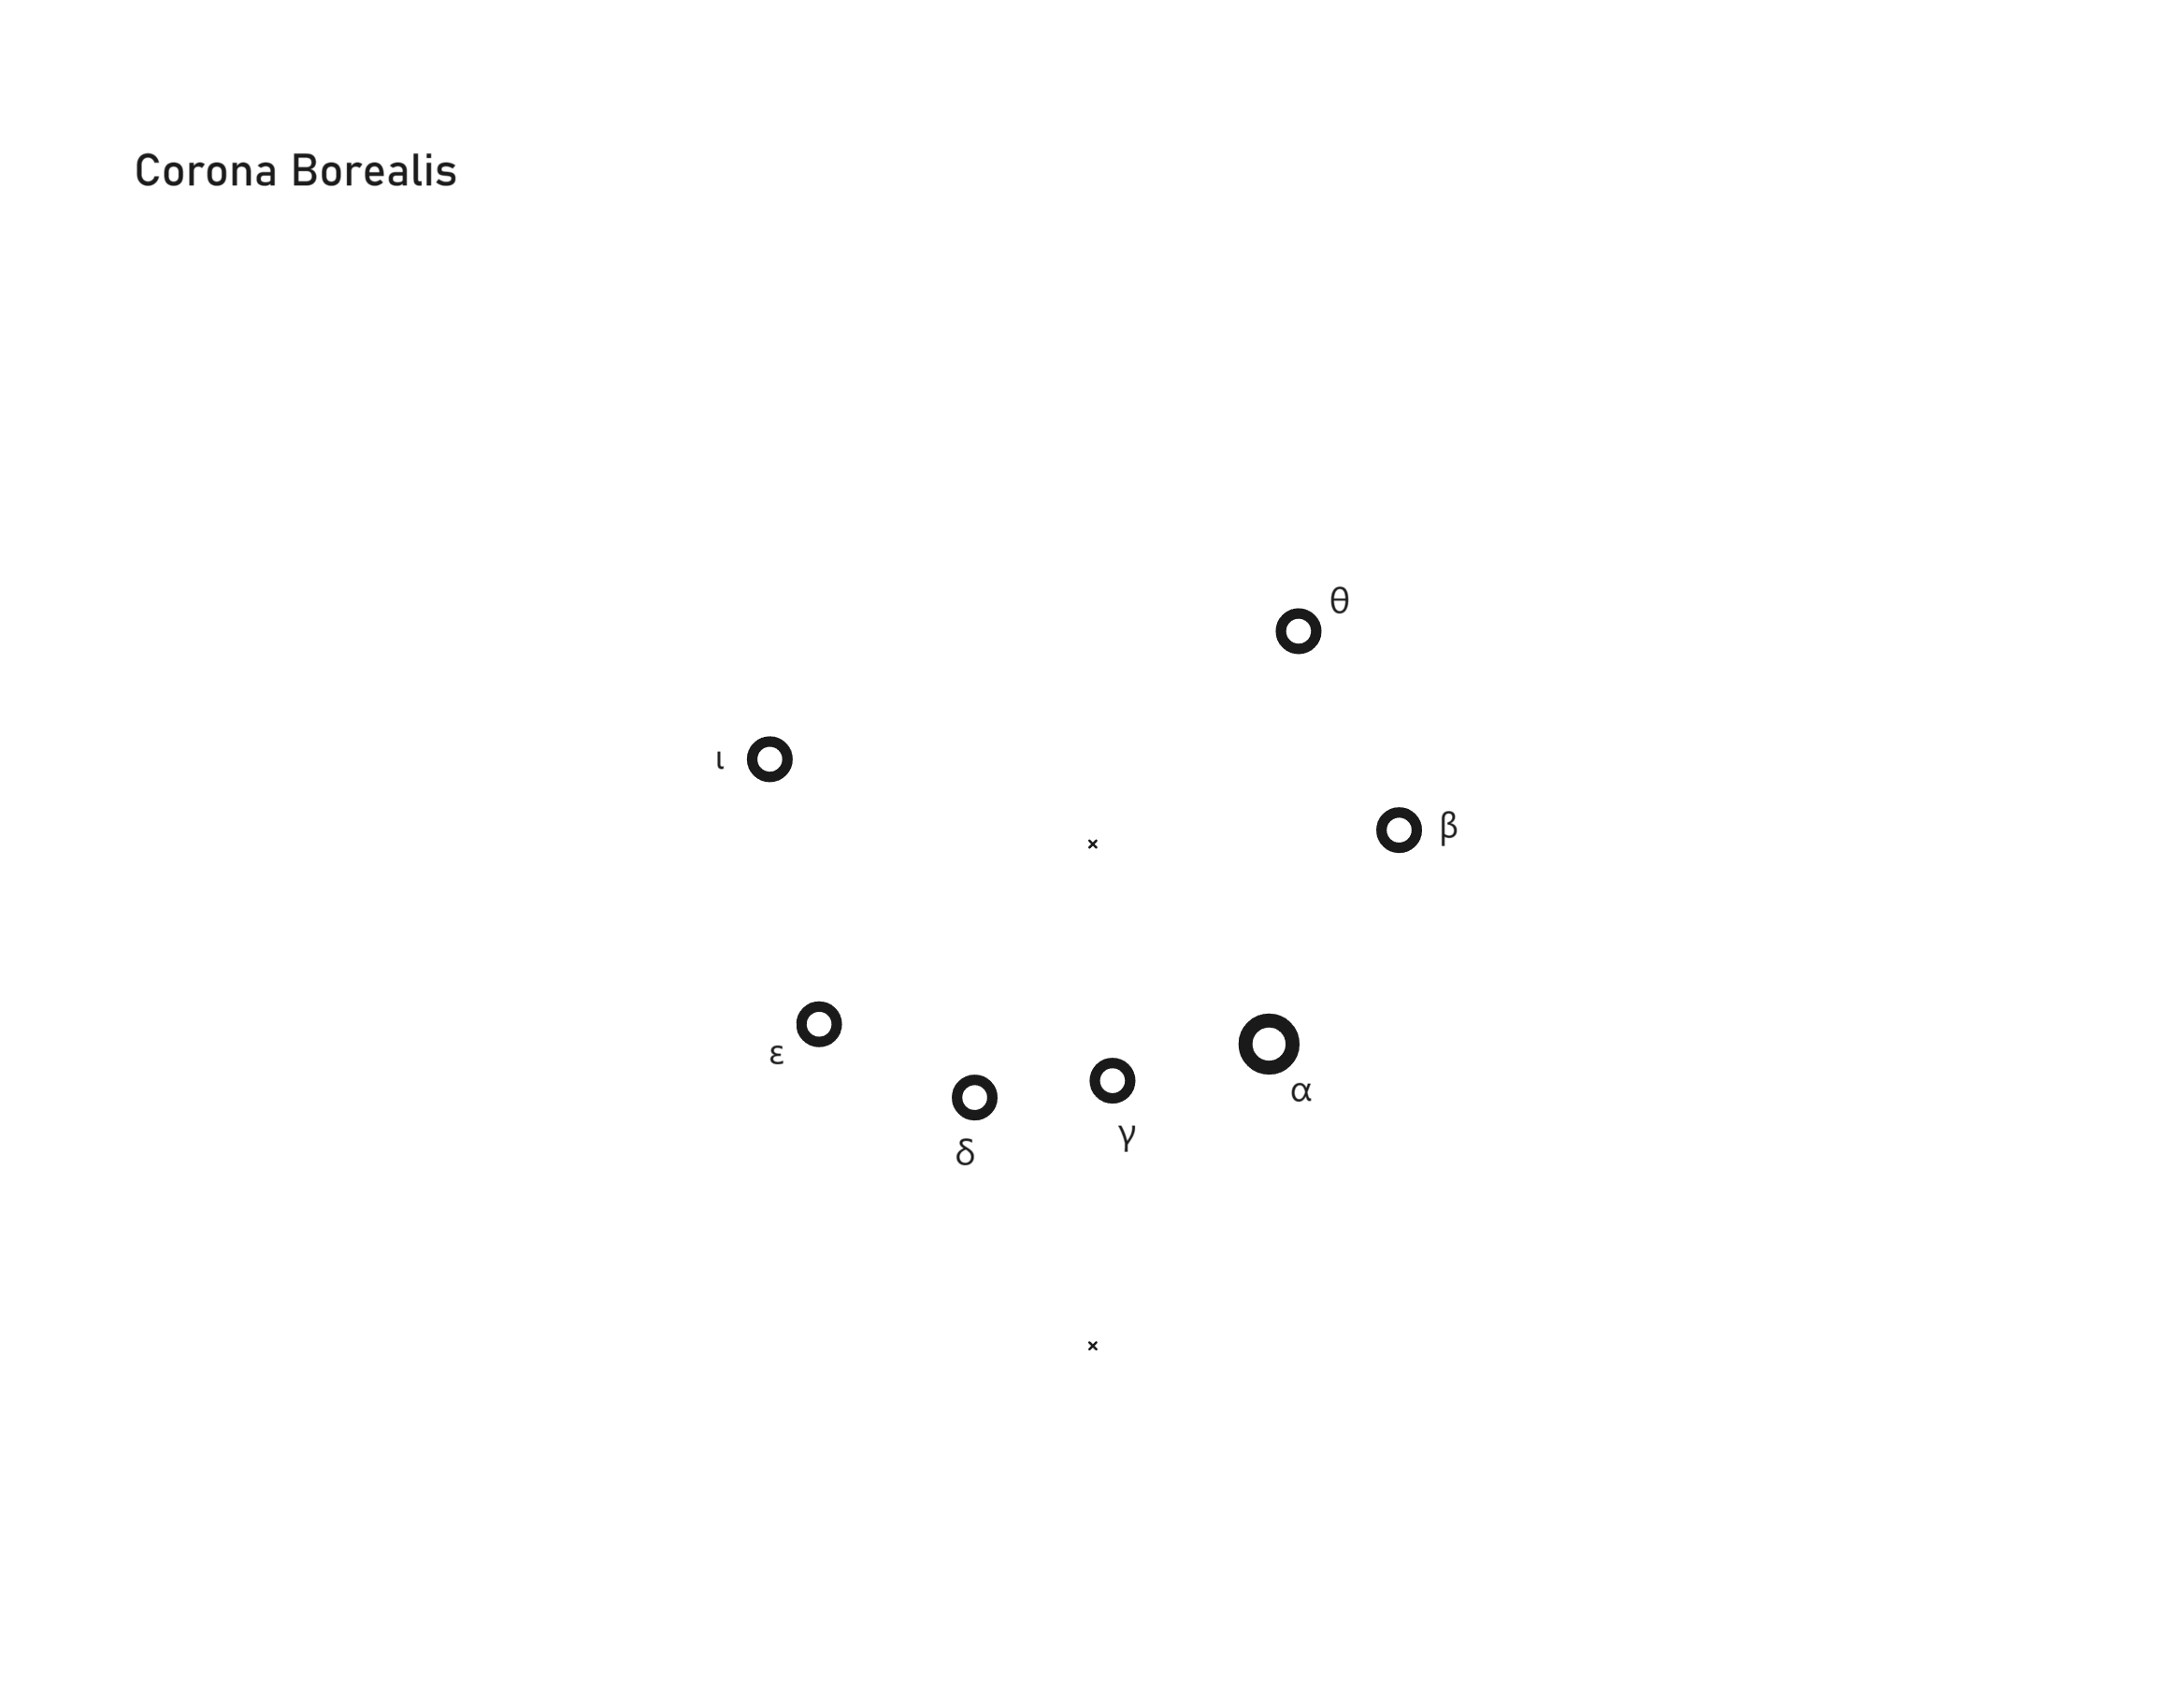
Corona Borealis constellation, unlabeled (left), labeled (right).

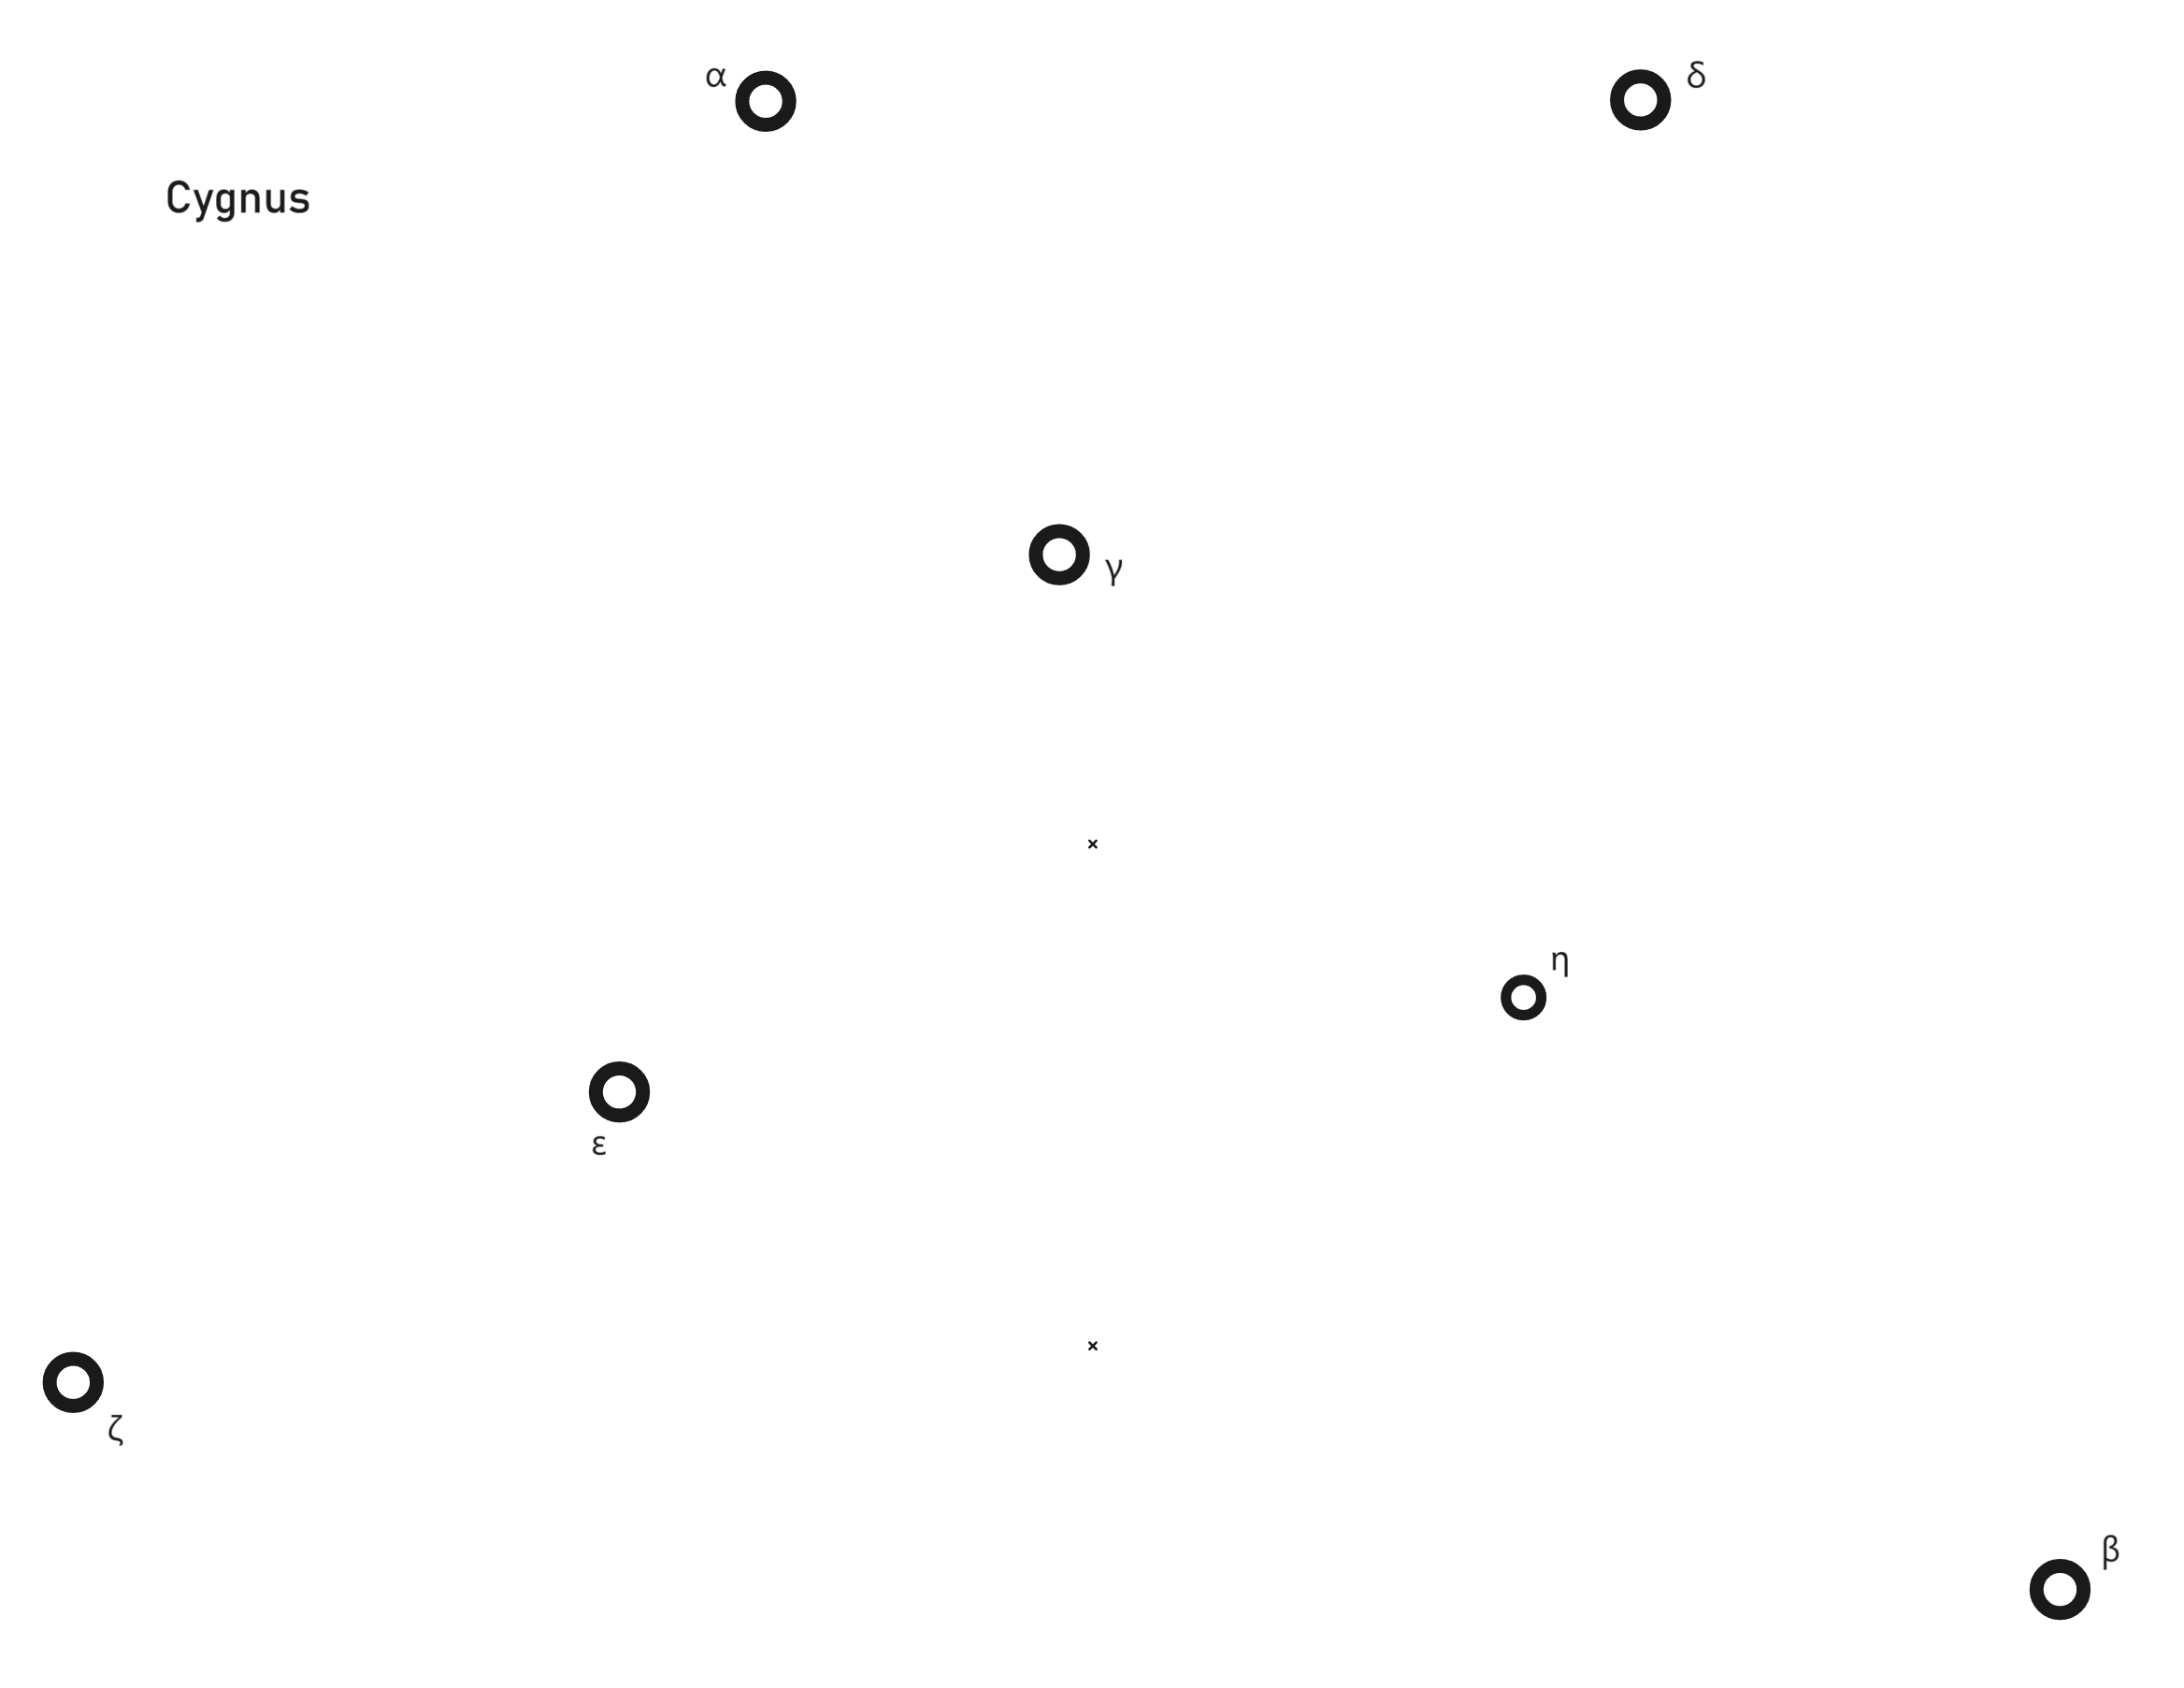
Cygnus constellation, unlabeled (left), labeled (right).
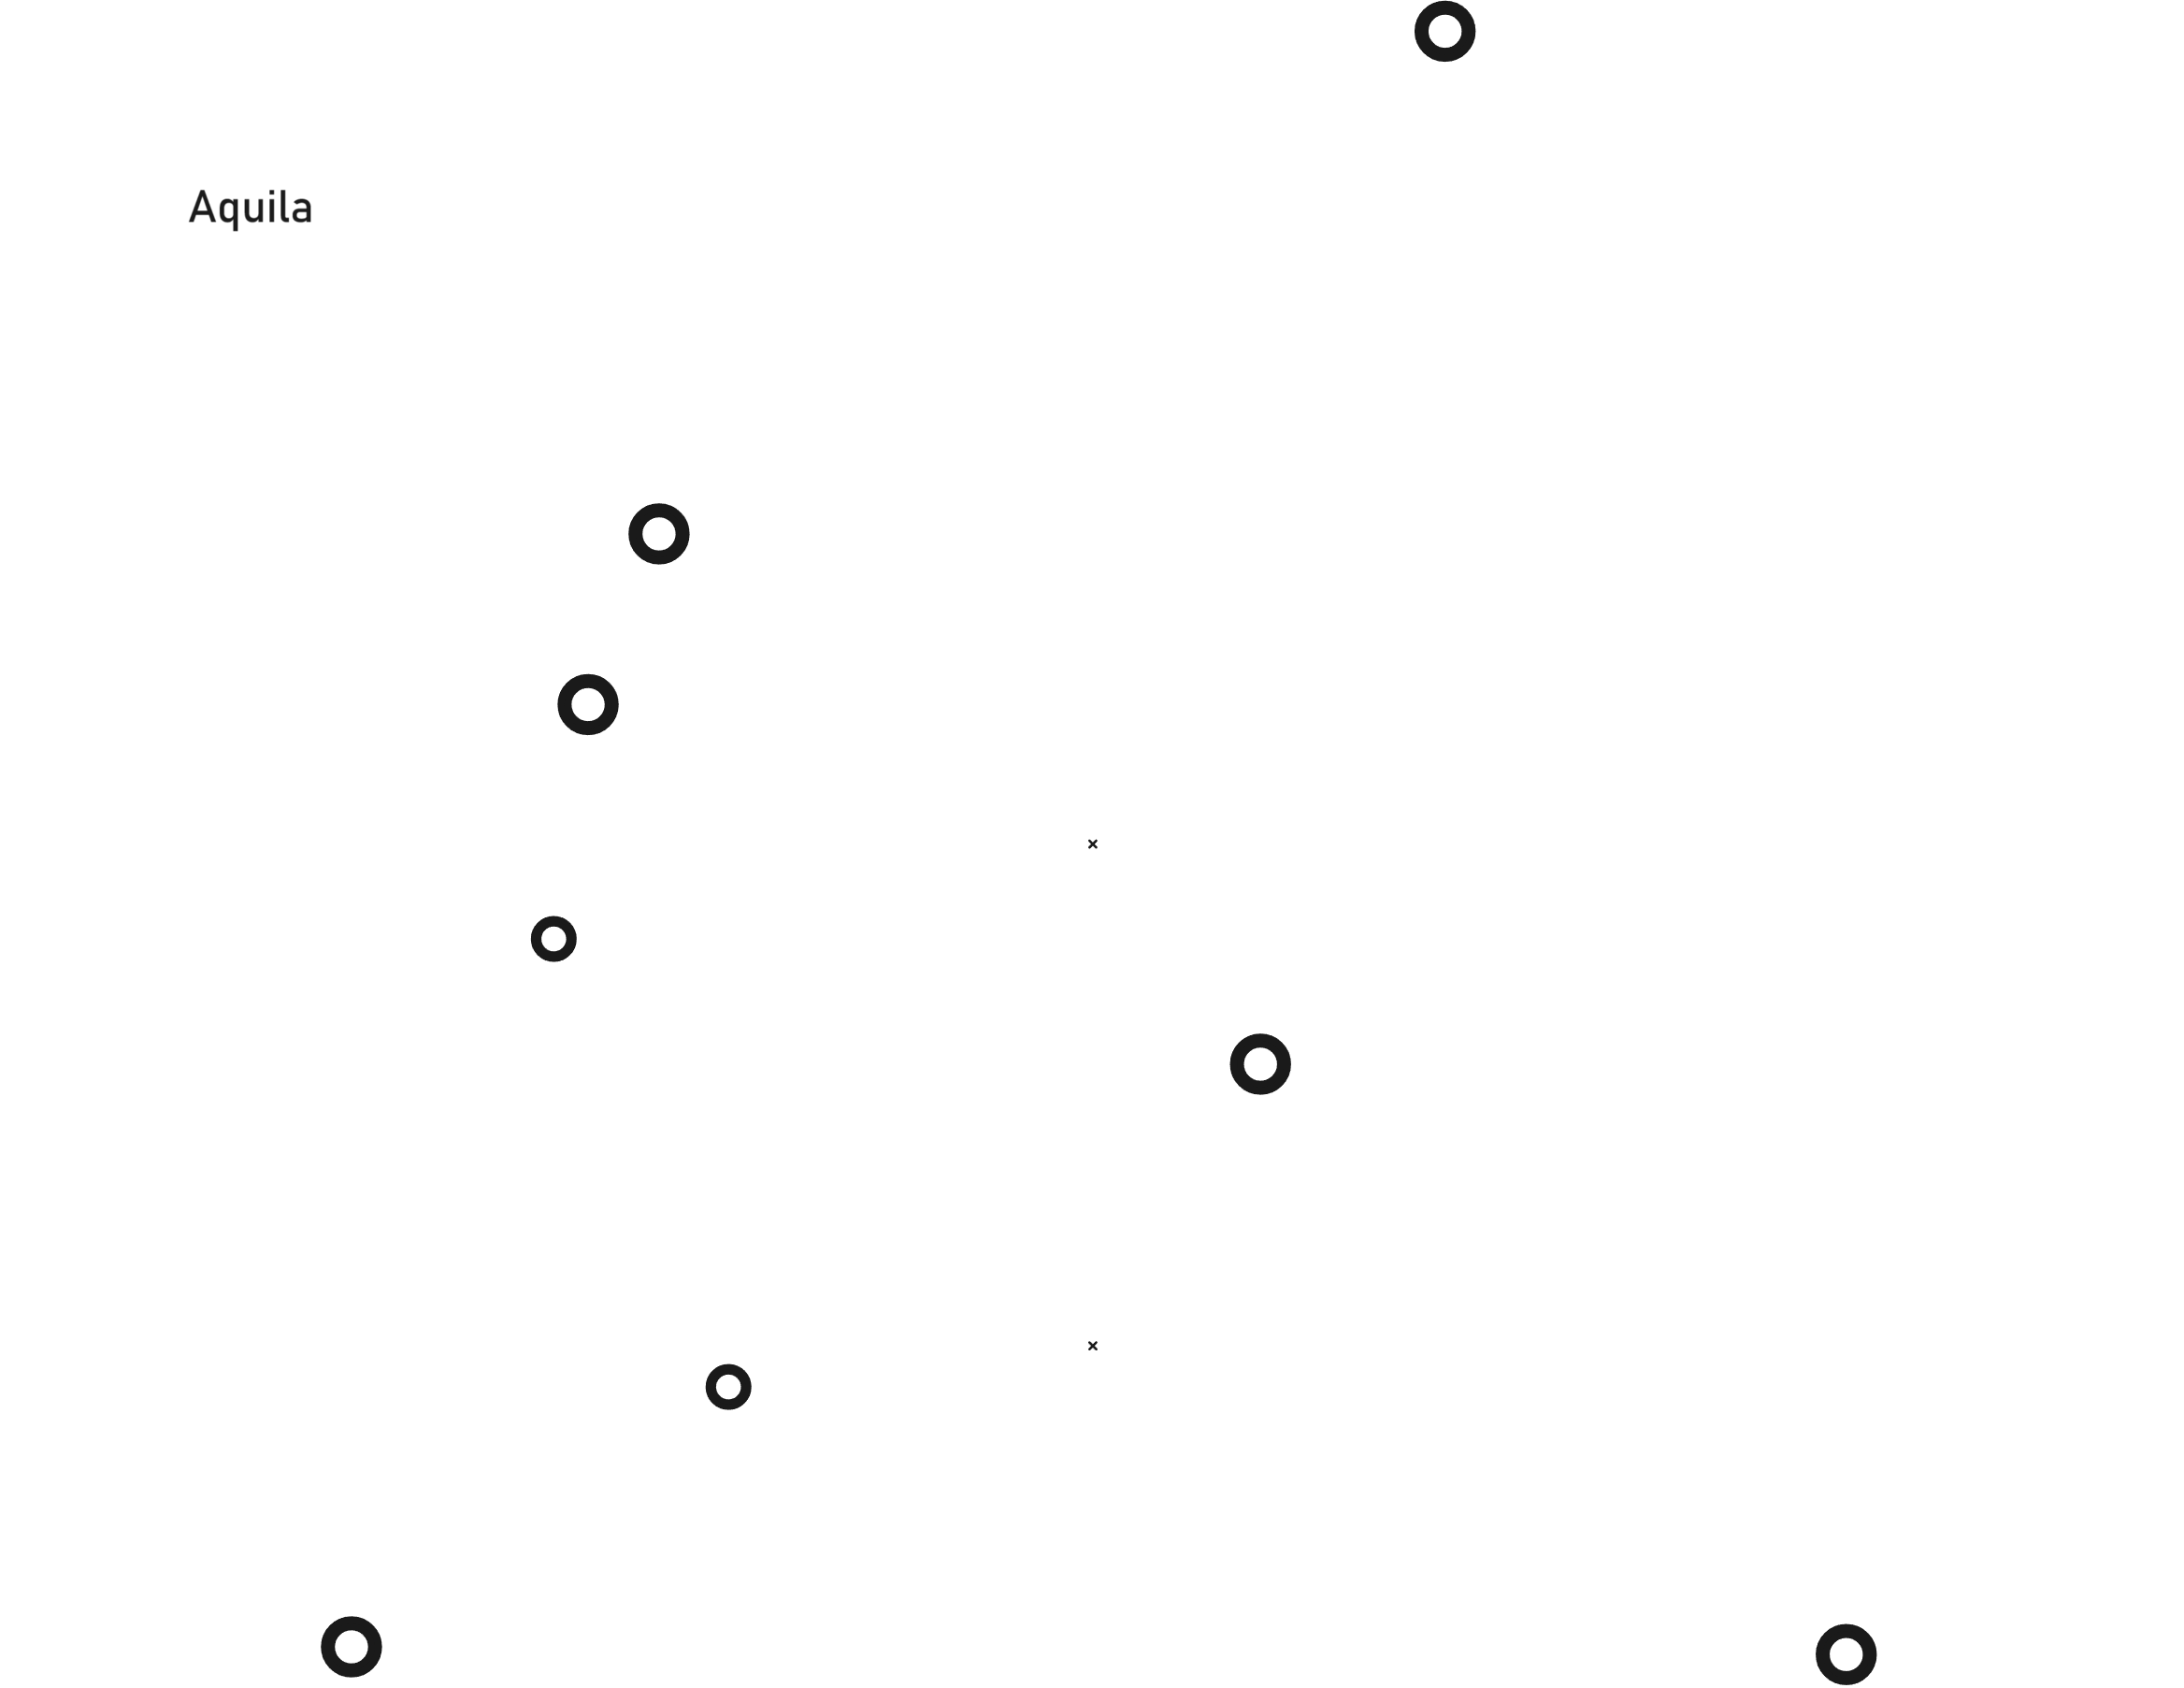
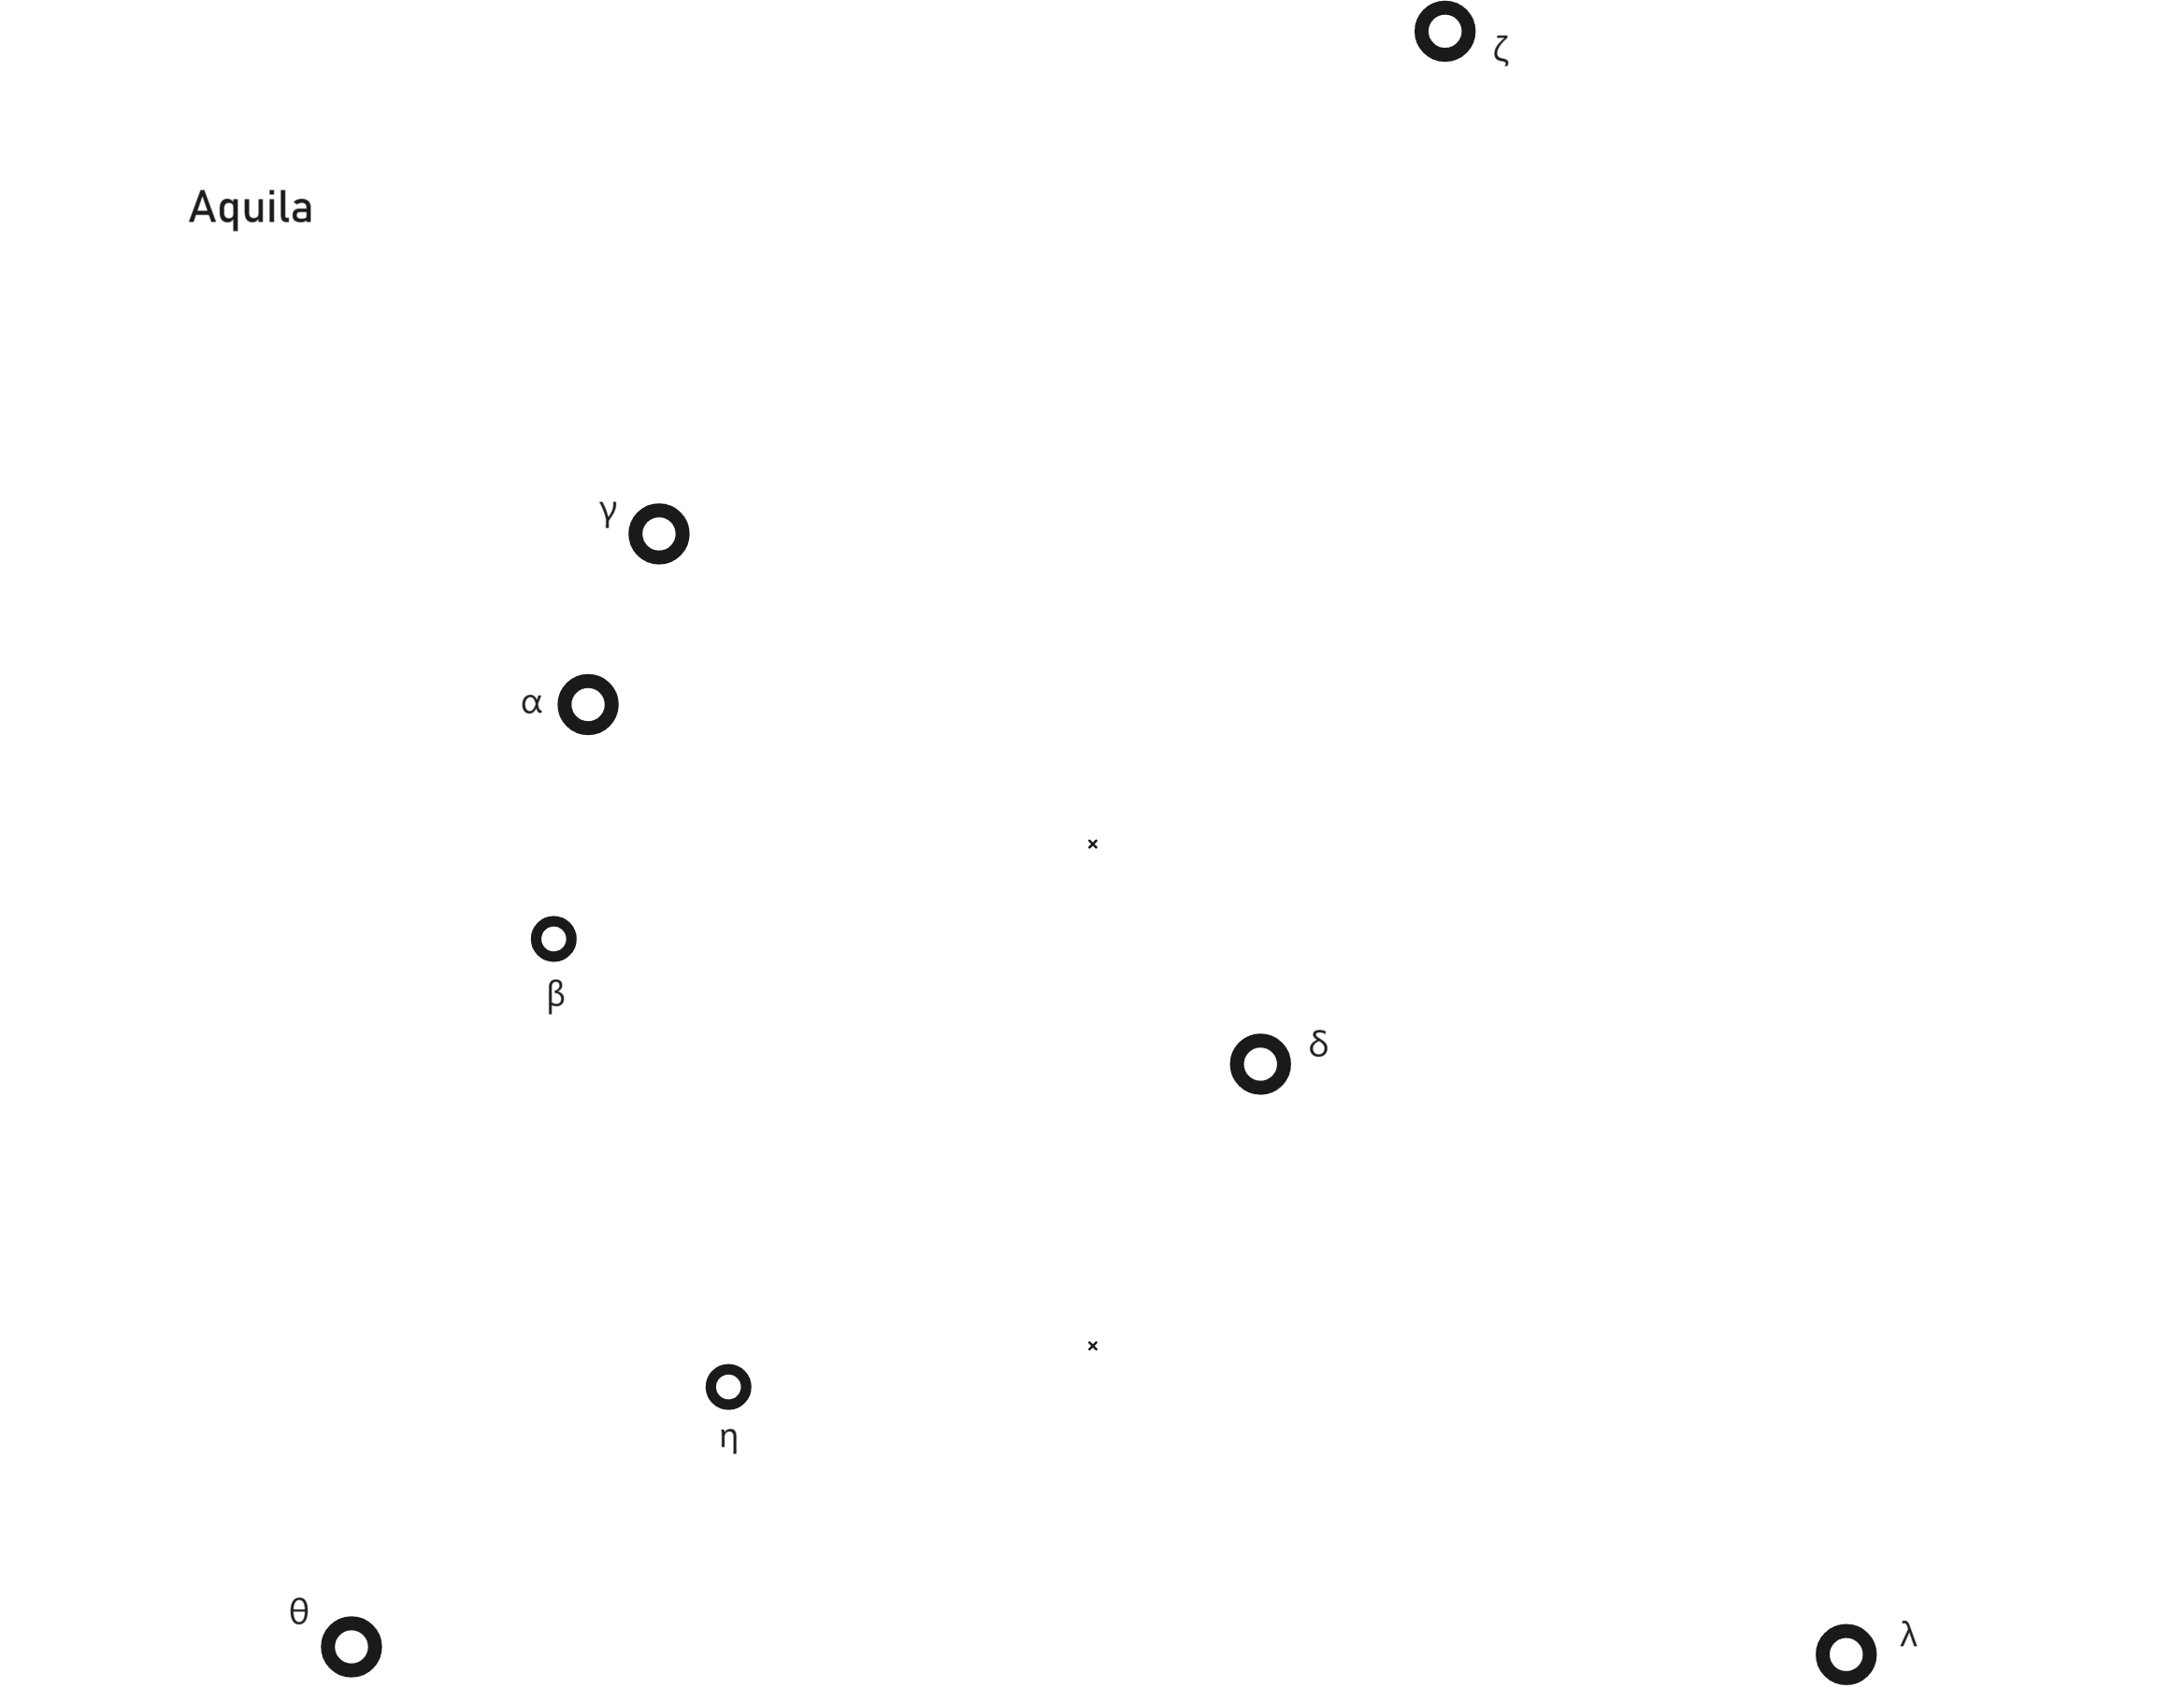
Aquila constellation, unlabeled (left), labeled (right).
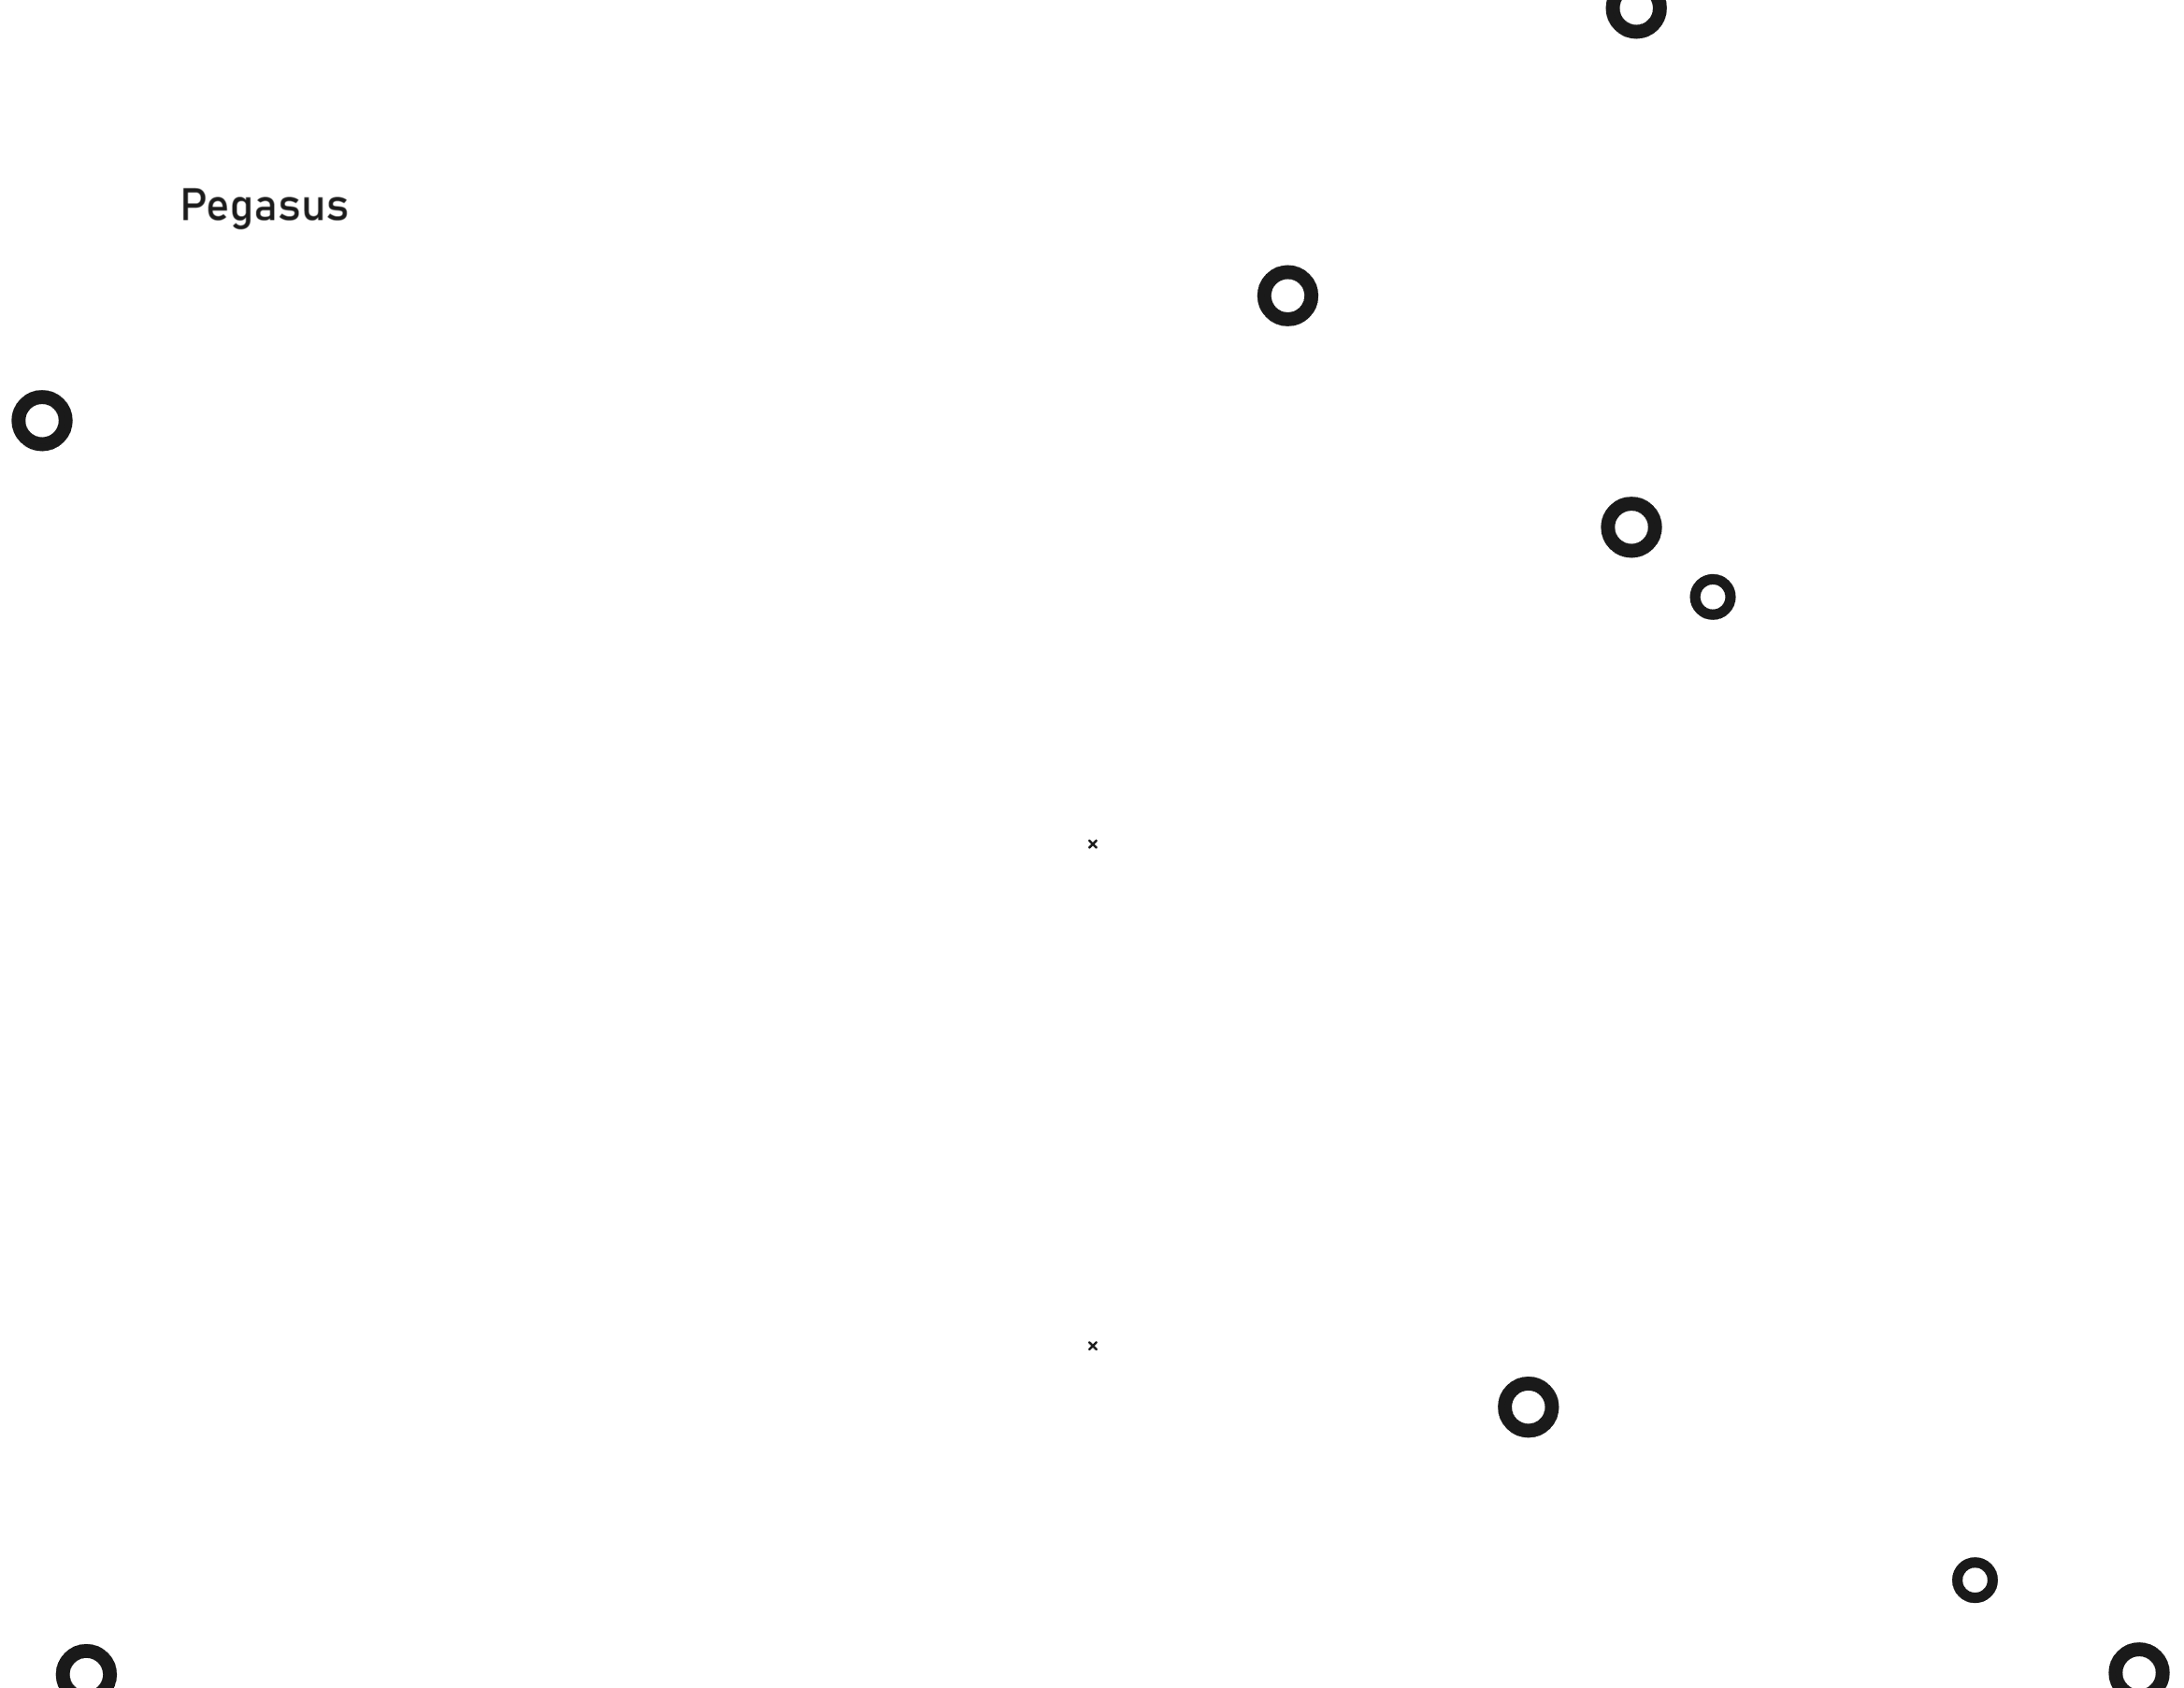
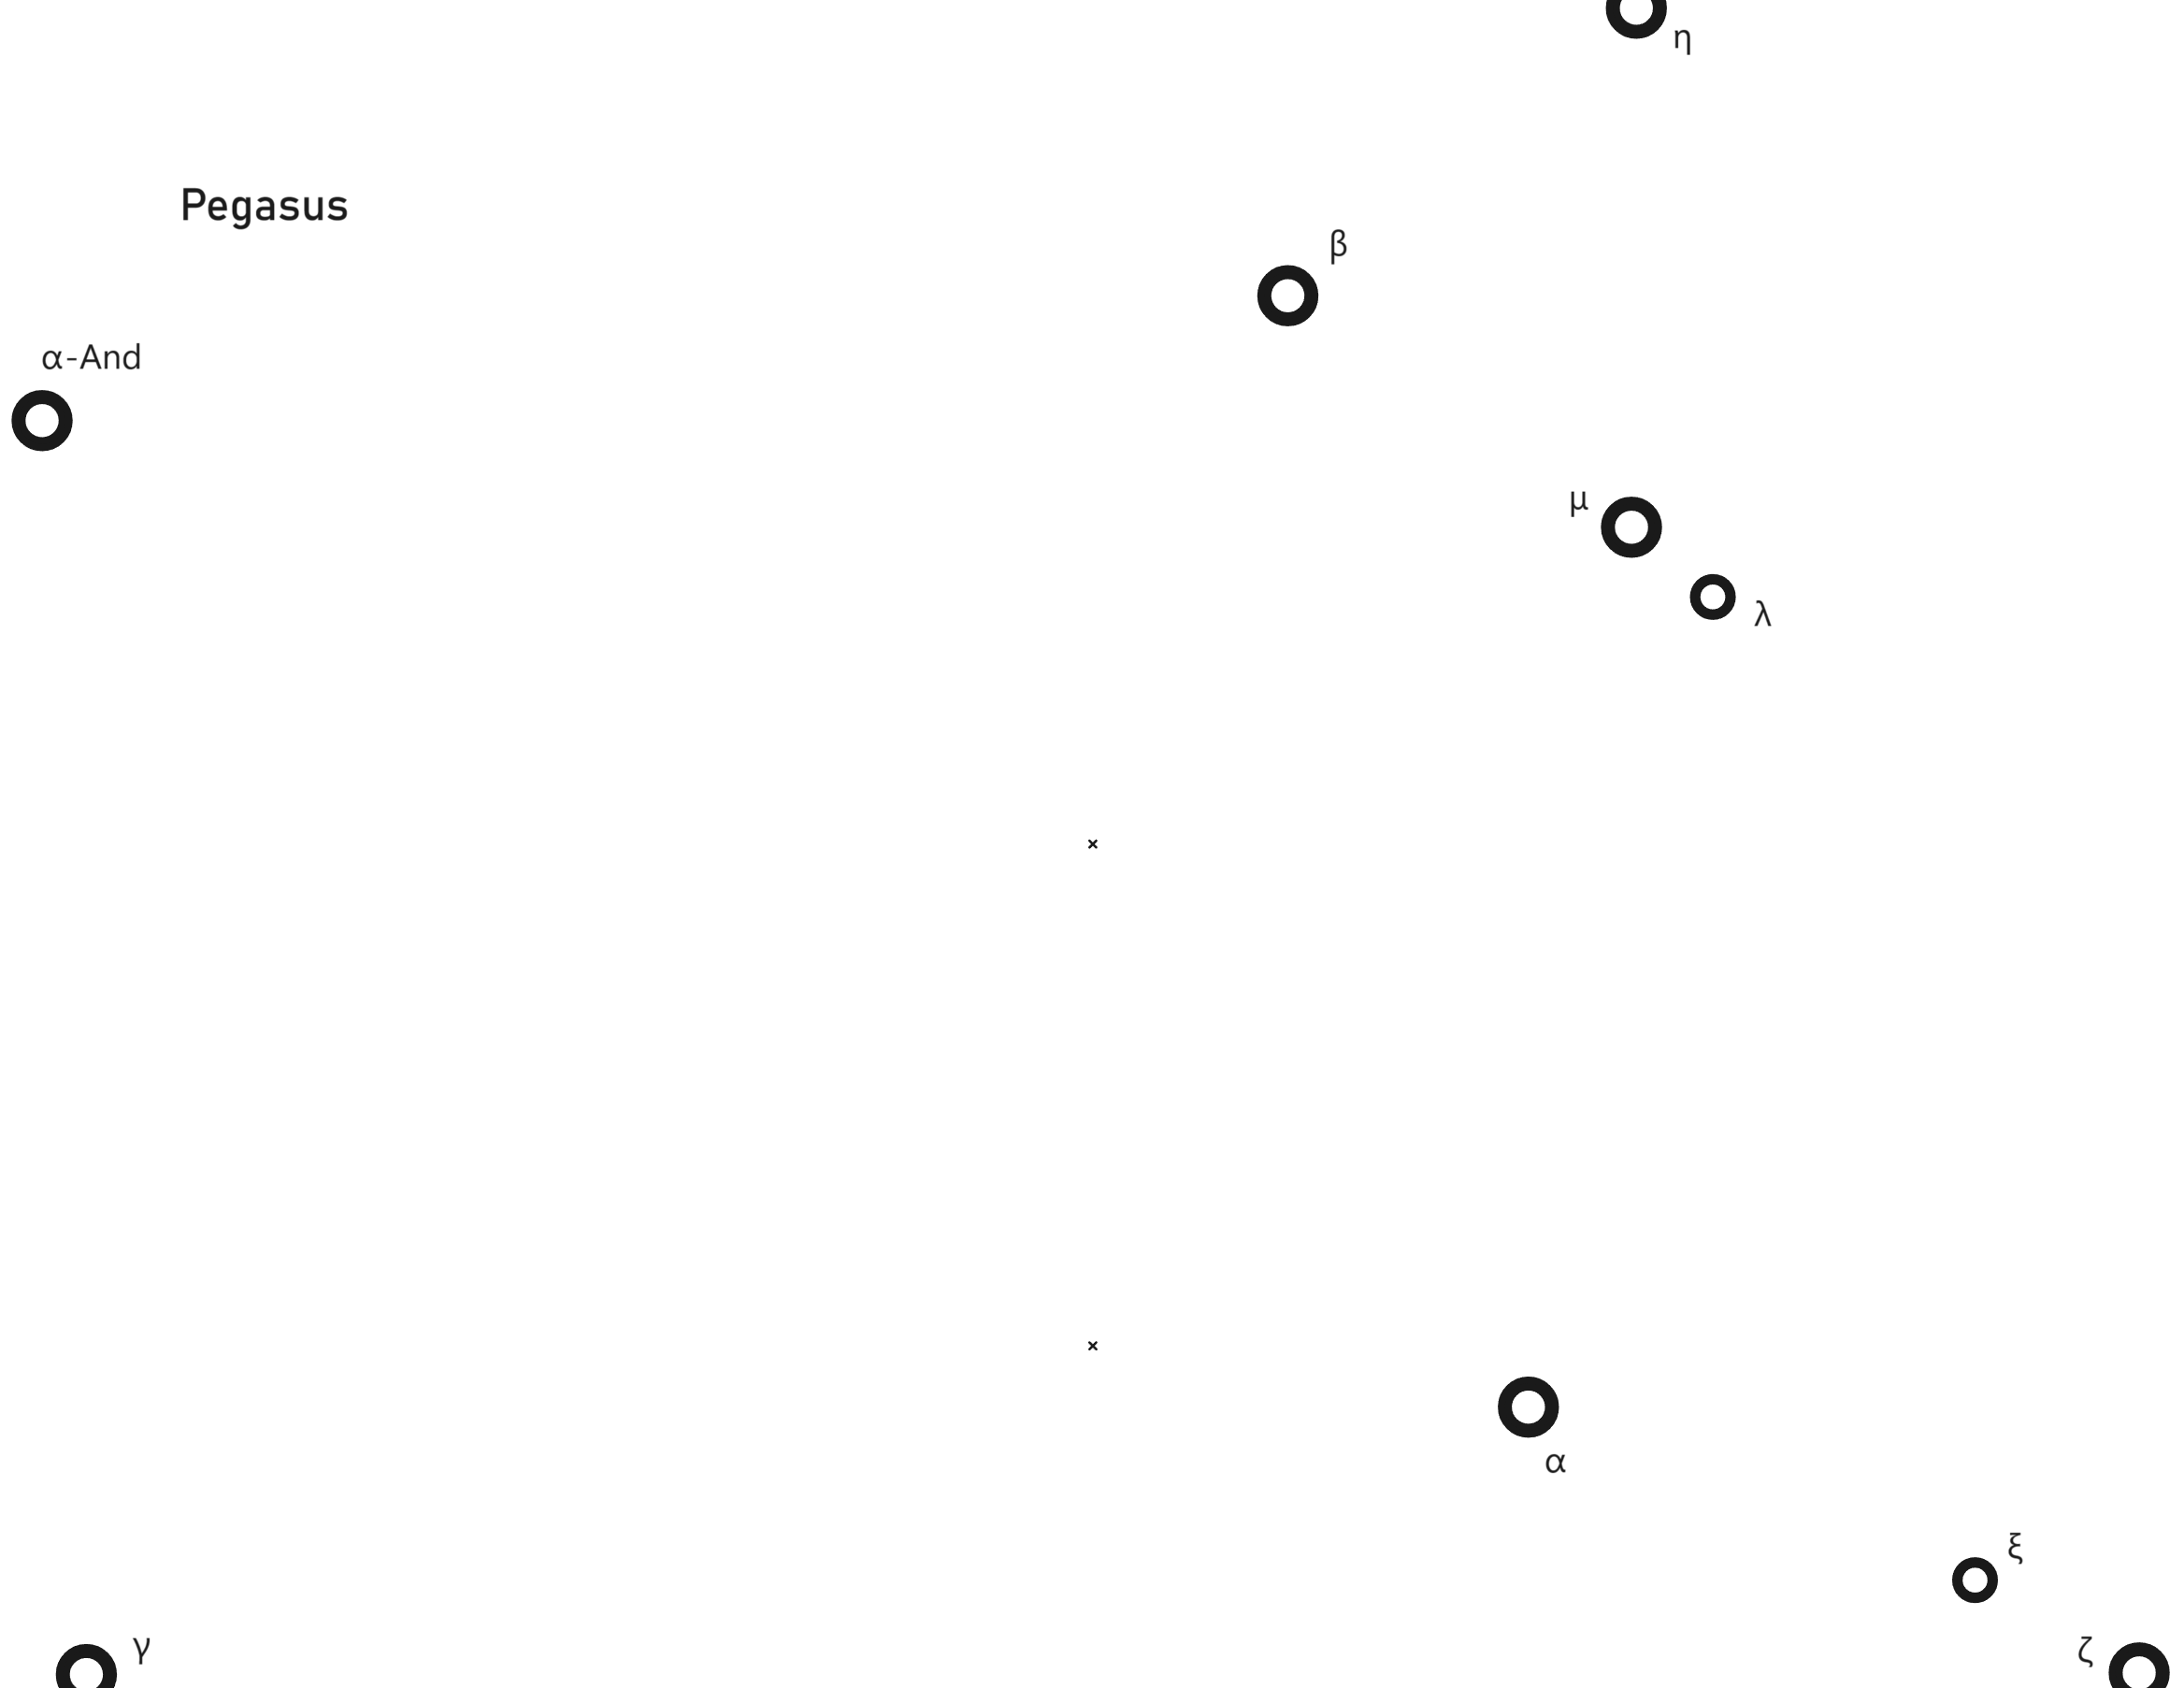
Pegasus constellation (and Alpha Andromedae to complete Great Square), unlabeled (left), labeled (right).
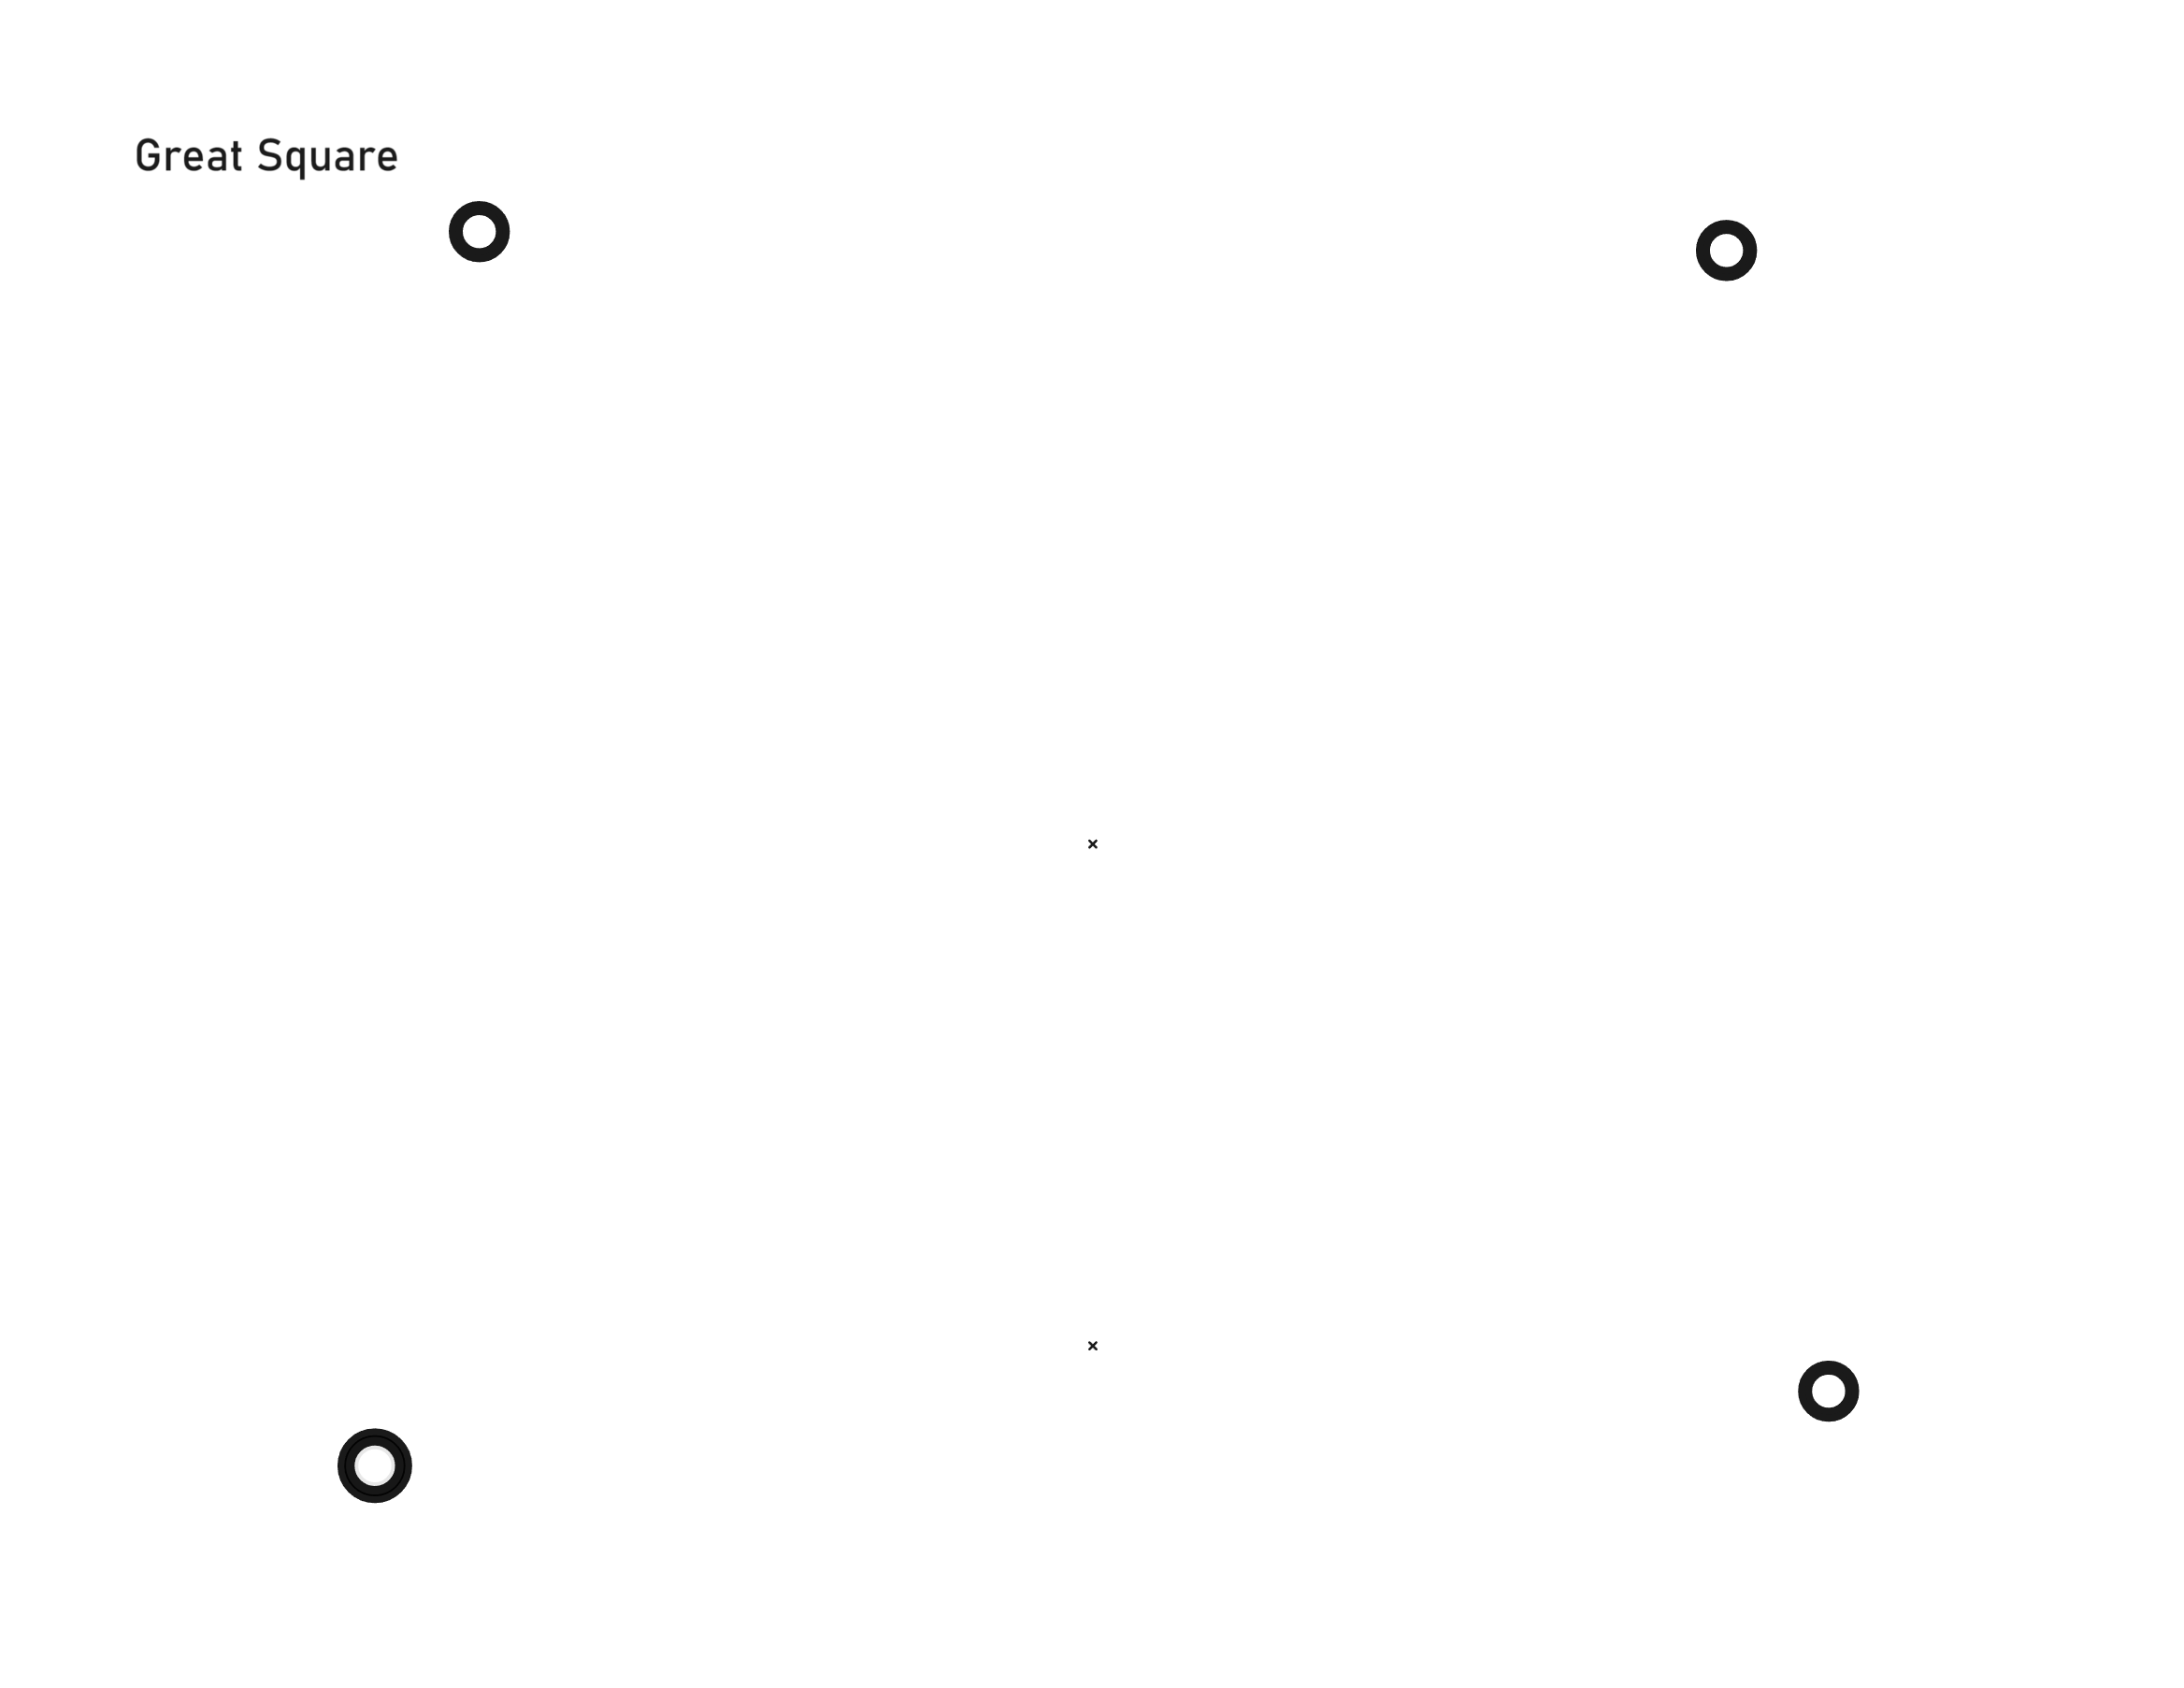
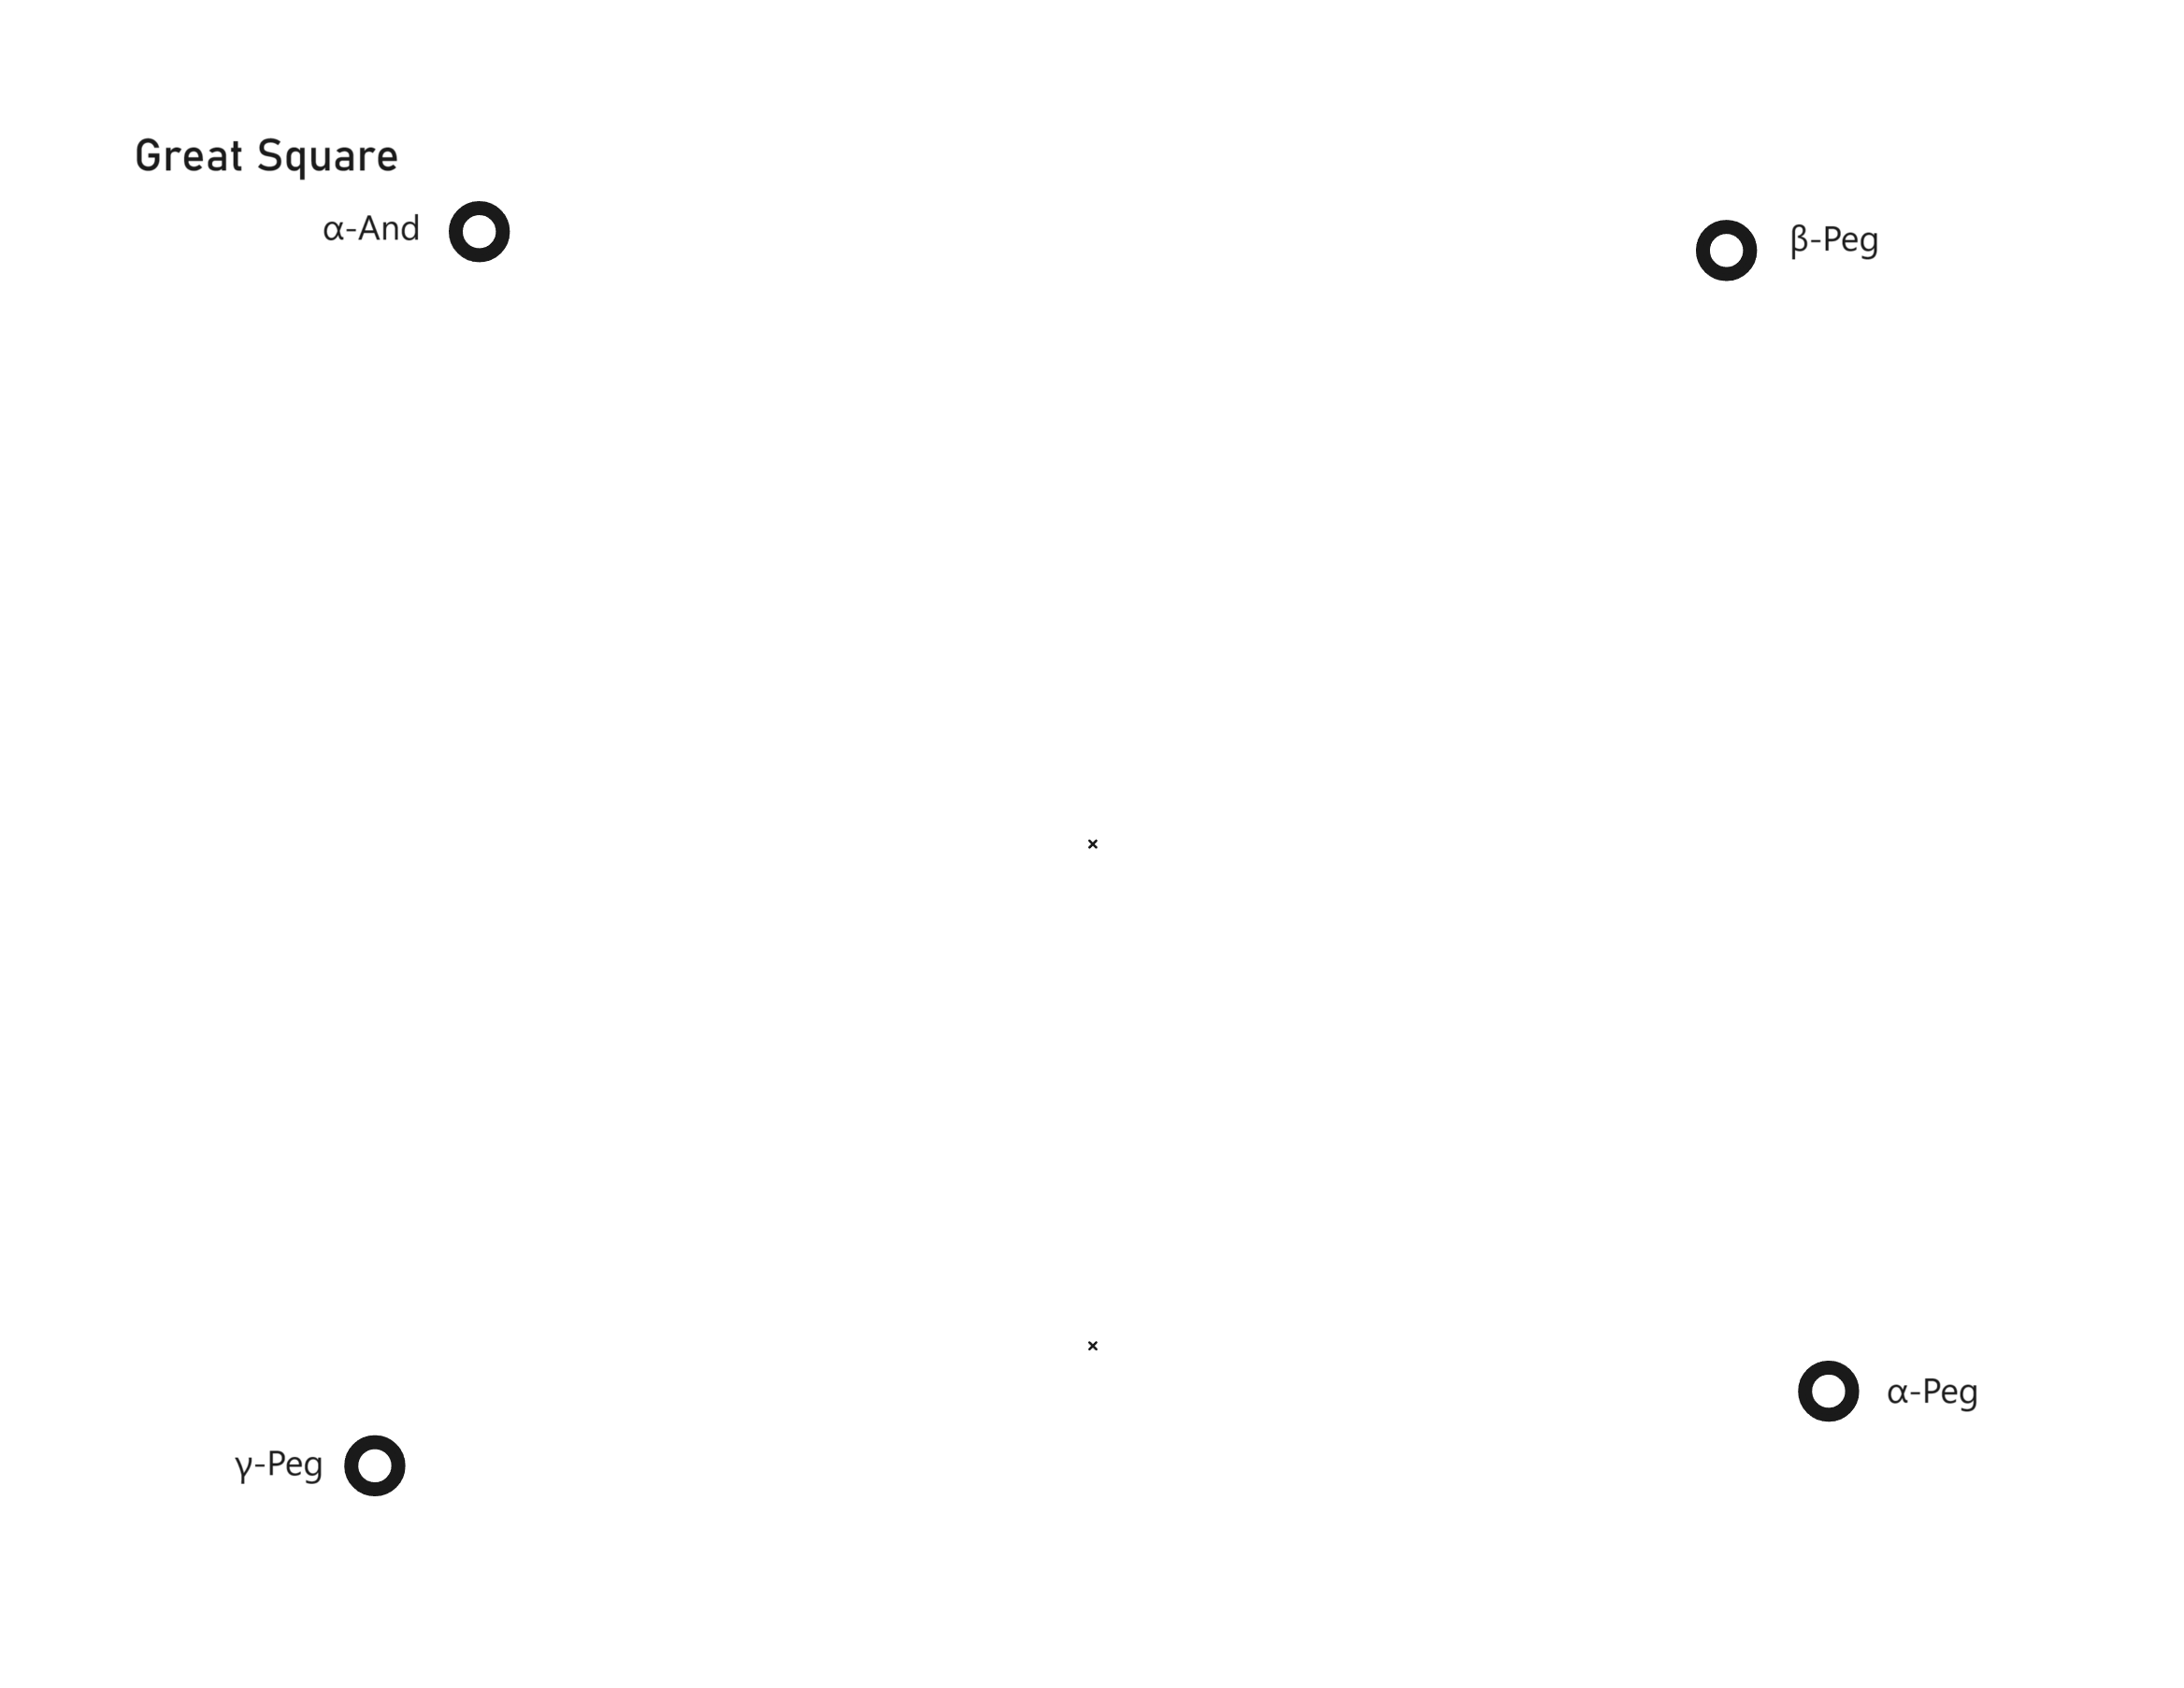
Great Square with 4 stars only, in case the above Pegasus map is too large to be printed, unlabeled (left), labeled (right).
To start orienting one's view in the night sky, a map including all constellations is useful. I would recommend the Constellation Finder by Dorcas S. Miller, which is a pocket-sized book with easy instructions and sky maps for each of the four compass directions during different seasons. This will give an idea of what patterns to look for and where in the sky they are located. Then, upon finding a constellation, one of the above printed projections may be used to confirm a successful match. I attempted printing them on a transparency and overlaying against the sky, which worked but was tricky to do. This may be more successful with darker skies which would improve the contrast, and with cutting out the regions inside the circles to prevent attenuation of the starlight; printing the projections with glow in the dark ink may be an interesting experiment. I found it easier to hold the projection just to the side of the actual constellation, and then mentally compare the shapes, because then the alignment of the paper does not need to be precise. It was even possible to use the printouts to locate faint stars that I otherwise would not have noticed. Use of the projected maps helped me obtain a more solid understanding of the above constellations, and from that point other constellations may be located by sight alone.