An observer will see the same light intensity, that is number of photons per steradian, for similar objects regardless of their distance from the observer.
What determines the appearance of sunlight reflected on a water surface? This phenomenon is visible when looking at a large body of water, particularly at sunset/sunrise: a 'line' of light seems to emanate due to reflection of sunlight from the water if the water is wavy, or on the other hand a clear image of the sun is seen if the water is very still. This article explores the effect of wave height and sun angle on the appearance of reflected sunlight on a wavy water surface. It is also applicable to general reflections on water, such as of buildings and other objects.
We begin with a few simplifying assumptions. First, the water surface is taken to act at each point as a flat mirror angled in a certain way - this excludes refraction, absorption/transmission, and frequency or angle-dependent effects. Second, we consider only once-reflected light, meaning the photon can strike the water surface only once (and not bounce between waves). Third, we assume waves are shaped as trochoids (due to the circular motion of water particles) and thus also exclude waves that 'topple' over which arise in strong wind. Finally, we treat the problem in one dimension only (angle along line to the sun, where behavior along lines perpendicular to this can be found in a similar manner), and assume an infinite array of waves, each one acting as an infinitely small mirror surface (this is a time-average behavior of real waves).
To treat the reflections on a real surface, it is necessary to establish an important result about light sources - that light intensity from a finite source is constant regardless of distance between source and observer. Here light intensity means the number of photons seen as originating from a certain angle (photons per steradian). This explains why although the number of photons drops rapidly per the inverse distance squared law, objects emitting the same number of photons appear equally bright at very different distances (for instance, streetlamps along a road, running from very close to the observer to the horizon, all appear to be equally bright instead of growing dimmer with distance) - that is, namely, because the (angular) size of the emitting object decreases with distance as well.
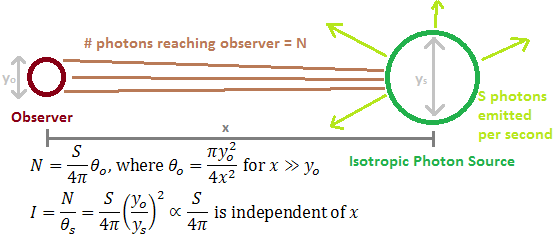
An observer will see the same light intensity, that is number of photons per steradian, for similar objects regardless of their distance from the observer.
Take a light-emitting source of diameter y_s, that emits S photons per second in 4pi steradians (meaning the object emits photons in all directions equally). Then take an observer with light collection aperture of diameter y_o. The observer and source are separated by a distance x. The number of photons that reach the observer can be approximated as S/(4pi)*T_o where T_o is the apparent angle of the observer's light collection area as seen from the source. We find T_o = pi*y_o^2/(4*x^2) for x>>y_o. The apparent angle from which these photons originate from the observer's view is T_s, which is similarly T_s = pi*y_s^2/(4*x^2) for x>>y_s (this is allowed if we split a finite source into a collection of point sources, as done for this analysis). Then the ratio, photons reaching the observer over the observed angle, is independent of distance due to both T_o and T_s depending on x in the same manner: I = S/(4*pi)*(y_o/y_s)^2, where we define the ratio as the 'intensity' I. Taking the limit of this to point objects we find I = S/(4*pi) - in this case we can interpret any finite object as a series of point objects, with the y_o and y_s parameters introduced to find a solid angle only. This means the apparent brightness of an object as seen by the eye or by a camera is only dependent on the object's actual light-emitting characteristic (S). This is one reason stars can be seen at night, despite the great distance to them.
With the above conclusion, we can emit the distance between observer and wave from consideration in this problem, leaving only the light's incidence and reflection angles as characteristic variables. The angles are defined with respect to a flat plane ('horizon reference') as shown in the image below:
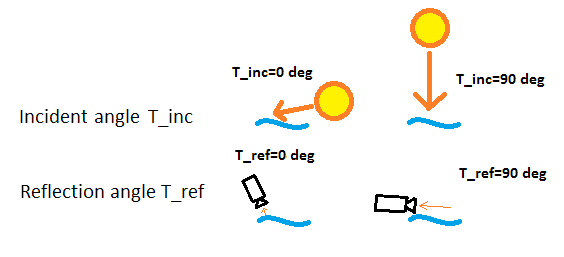
Visual definition of two important angles for this problem, the incidence angle T_inc and reflection angle T_ref.
The incident angle, T_inc, is a constant describing the sun's angle in the sky, which here can range from just above 0 (close to the horizon) to 90 (directly overhead) degrees. The observed reflection angle T_ref similarly ranges from just above 0 (near the horizon, far from observer) to 90 (close to and under observer) degrees.
The wave is modeled as a trochoid, as previously mentioned. Because the effects are taken to be as infinitely many points, only the angle of the wave matters (as opposed to its actual height and width, which affect time-dependent behavior). The resulting wave shape is plotted below, each line representing one of 17 amplitude levels:
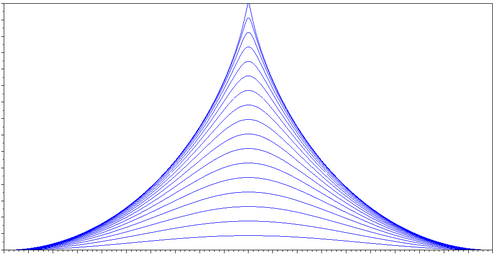
Plot output of the shape of waves generated by the trochoid model.
To get the reflected light angle T_ref, the slope of the wave shape function is determined at each point, and some trigonometry is used assuming a tiny plane mirror at each point of the wave. This results in a curve like shown below:
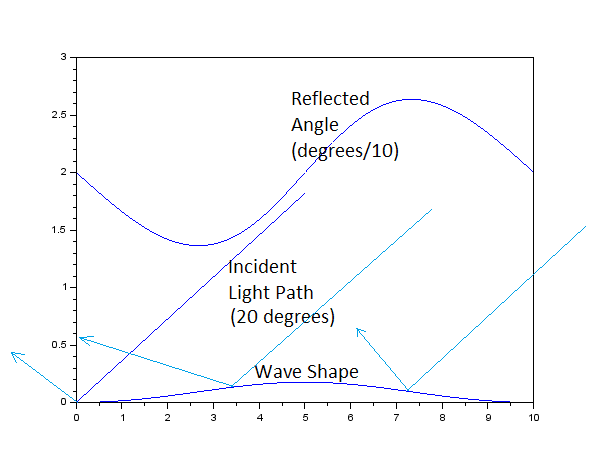
A low amplitude wave shape from the previous plot is shown on the bottom of this figure. On it are incident three representative photon paths that travel at the same angle towards the wave but are reflected at different angles based on which part of the wave they hit. This reflected angle at each point of the wave is plotted in the top curve of the figure.
As the wave amplitude increases though, the simple model is not adequate. First, it should be expected that if a peak is well above the rest of the wave, it will prevent light from reaching parts of the wave (or create a shadow on the wave). This is accounted for by removing all calculated reflections which fall within this range:
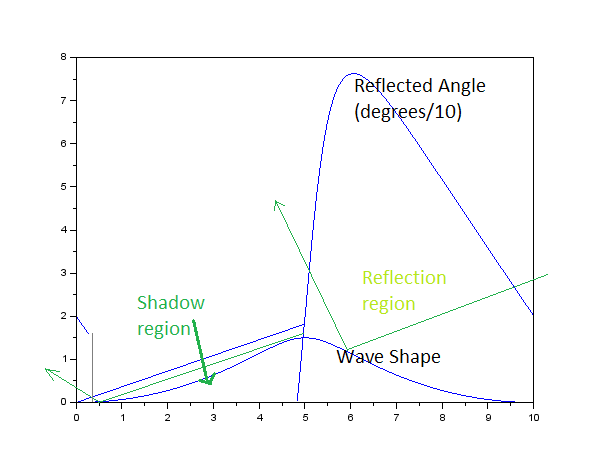
A higher peak creates a region of the wave which will not reflect any light (since the peak blocks sunlight from reaching the water surface). This is shown in the figure in a similar format as the previous plot.
As the amplitude increases further, it is possible that a wave's peak will block light from reaching the next wave's peak. This is also added to the model (by assuming infinitely repeating waves):
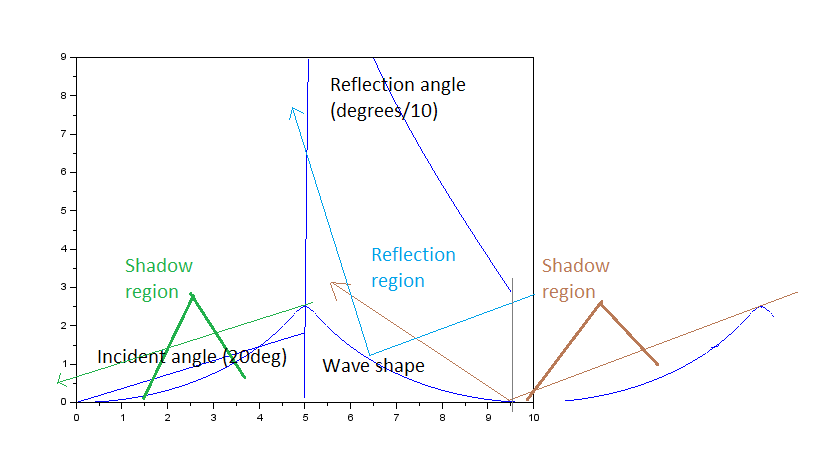
It is posssible for one wave (shown beyond the bounded area here) to affect reflection on the wave under consideration (within the bounded area). This is also considered in the model.
At this point we have the emitted angles of light for different waves. We use the time-averaged behavior assumption and treat the wave as a point source randomly emitting along one of the angles (with the shadow regions acting as no emission but accounted for in the probability distribution). The code for the simulation is available here. Since the intensity of a point source is independent of distance, this behavior can be easily compared to real systems, as long as 0 degree T_ref is synonymous with 'near the horizon' and 90 degree T_ref is 'close to the observer'. We convert the curve representing reflection angles into a probability distribution by making a histogram from the data (the below images match the first two wave shapes of the above three):
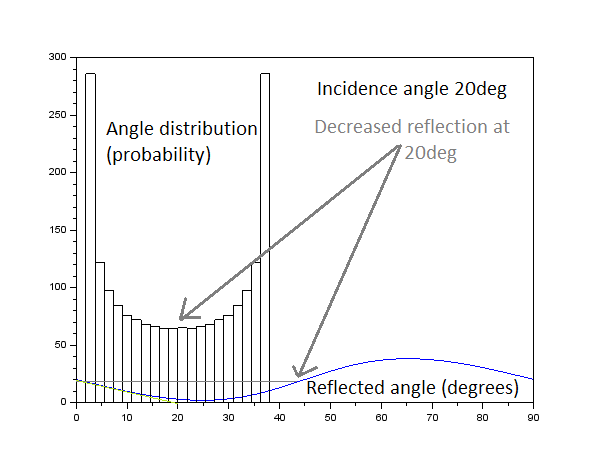
The reflected angle distribution for a lower-amplitude wave is clustered around the incident angle, but peaks at the extremities (due to higher probability of the wave surface reflecting at a tilt as opposed to as a perpendicular surface). Note that axes have different meanings for the curve and the histogram, for the former the y-axis is degrees and x-axis is wave position, while for the latter the x-axis is degrees and y-axis is frequency.
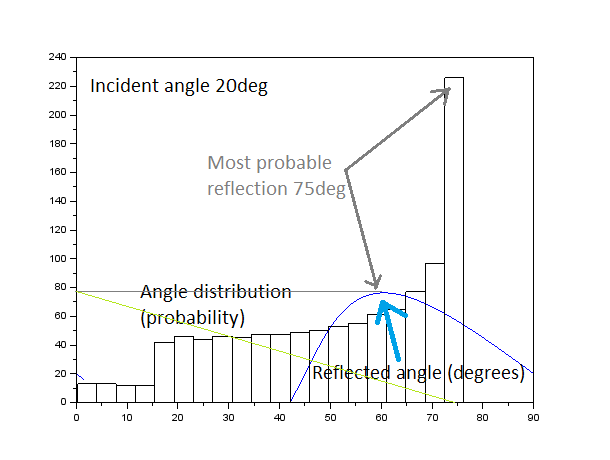
The reflected angle distribution for a higher-amplitude wave does not show regularity, and remains visible to 0 degrees (observer's horizon), a much wider range than the lower-amplitude waves. The axes have different meanings for the line plot and histogram as described above.
We can already make a few observations about the behavior. First, it is highly dependent on wave amplitude, with very still water reflecting only along a narrow angle (thus appearing like a mirror surface), but even slight disturbances adding significant spread to the angular distribution and 'blurring' the reflected image (this can also be used to observe the nature of waves on the surface (and thus wind patterns etc), particularly if the analysis is extended to 3D reflections). Second, for low amplitude waves we expect a 'double' image of the sun to form, on either side of the expected mirror image, due to the splitting of the angular spread as seen in the first distribution. Third, there is evidence that the angles extend to the horizon, which is observed in real water reflections.
To get a more definitive view of this phenomenon, a set of 2D plots were constructed. Each plot is normalized, so data cannot be compared between plots (but can be compared within plots). In the plots, white represents a high angular distribution value (the sun's reflection is highly visible) and black represents a low angular distribution value (the sun's reflection is not well visible), and the other colors are in-between. The first plot considers the incidence angle (angle of sun in the sky) on the y-axis, with the bottom of the plot corresponding to T_inc=5deg (sun near horizon). The observer angle is on the x-axis, from 90 degrees on the left of the plot (since this means close to observer) and 0 degrees on the right (far from observer, near horizon). So for a particular angle of the sun in the sky, a horizontal trace from left to right on this plot represents what the observer sees from closest to farthest away on the water surface. (For an object that is close to the observer, such that the incidence angle changes with distance, an upward-angled line should be used (as horizon is reached on the right, the object's light will be incident at a steeper angle at the top of the plot).) These plots are drawn for constant wave amplitude, given at the top right corner. Again the reader is warned to not compare colors between figures since the scales are different.
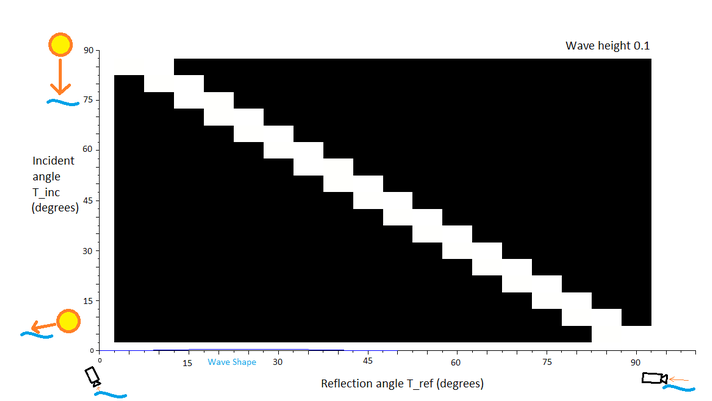
The incidence-reflection plot for very small waves. This states that the sun will only be visible at its actual angle, in other words the water is acting as a mirror surface when it is still.
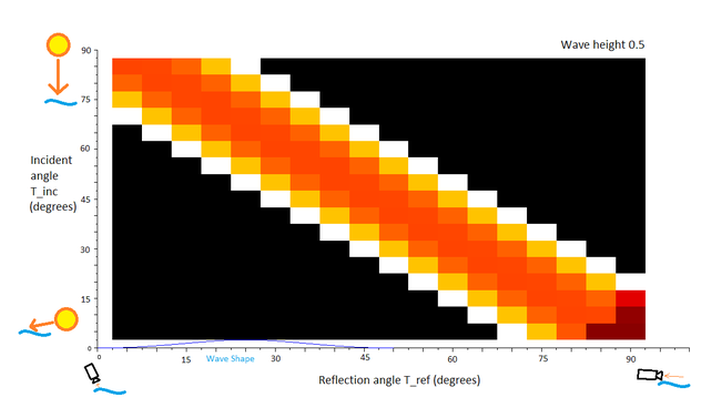
The incidence-reflection plot for small waves. At this point the sun starts to appear blurry, with two effective images formed (although they would appear more blurred due to the non-infinitesimal angle of the sun in the sky).
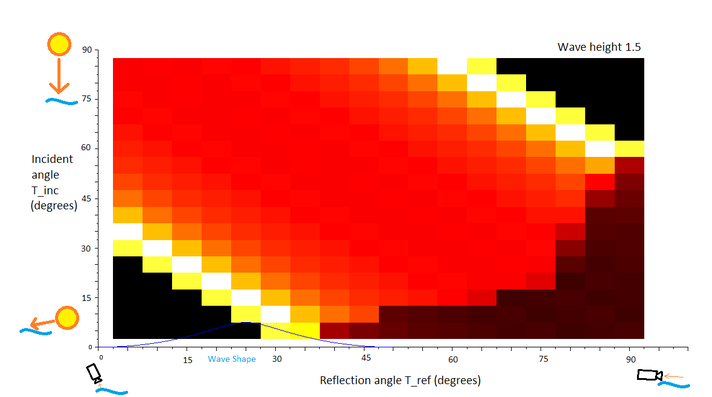
The incidence-reflection plot for medium waves. The sun becomes increasingly blurred (a 'line' appearance on the water), with slight peaks towards and away from where the expected mirror image would lie. Some fading is expected near the horizon for low incident angles.
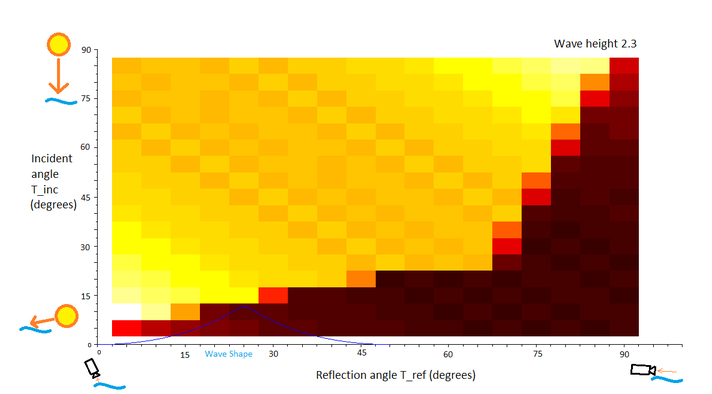
The incidence-reflection plot for large waves. The image of the sun is thoroughly blurred with only a near-uniform line appearance and hard-to-see boundaries. Fading near the horizon increases for all angles.
The plots above give an idea of what to expect as the incidence angle changes for a given wave height. Now, assuming a fixed incidence angle we plot the same function in terms of wave height, which provides a way to make a comparison between the above four figures.
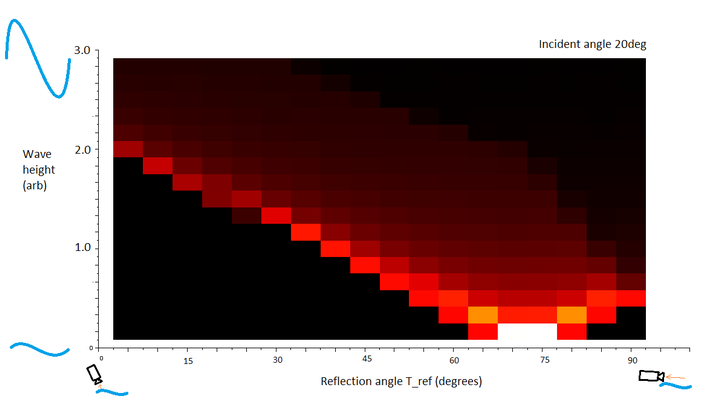
The wave height-reflection plot for 20deg incident angle. The sun is most visible at low wave height and blurs and becomes dimmer as waves increase.
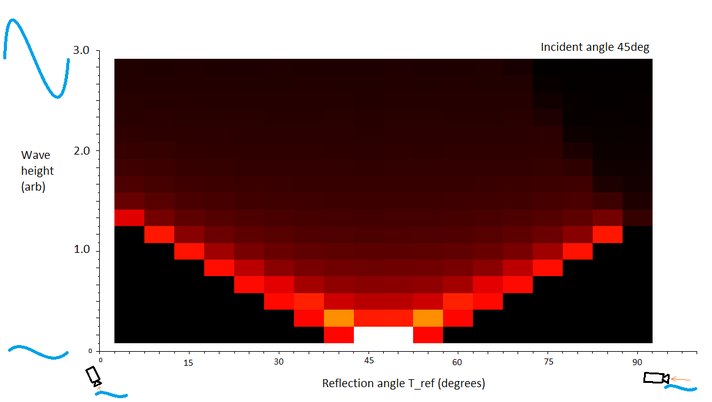
The wave height-reflection plot for 45deg incident angle. The features are similar to the 20deg plot. The sun is seen to become much dimmer as wave height increases, but in exchange it becomes visible over a wider range of angles.
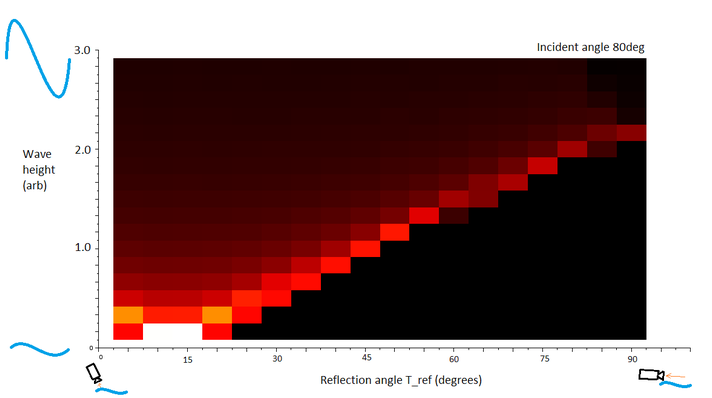
The wave height-reflection plot for 80deg incident angle. The features are similar to the 45deg plot.
Is this model any good? We try to find evidence in photographs on google images. There is difficulty in verifying the model, because most photos end up overexposed in the regions of interest due to the sun's brightness. Even with high shutter speed, it is fairly difficult to tell what is going on (and getting a time-average long exposure photo, which would be ideal to verify the model, is out of the question).
A fast shutter speed photo of the sun reflecting off a river. It is difficult to verify the model, but an almost uniform distribution seems appropriate.
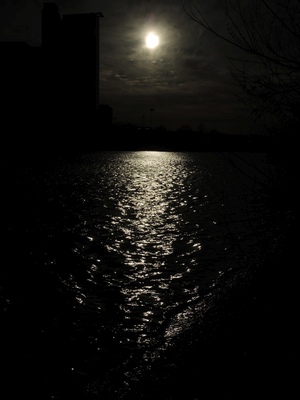
Perhaps moon photographs might yield a bit more information. Here it is important to not use artistic renderings (which populate many google image searches) because they will not have the desired accuracy. Two decent candidates are the photos below, taken from http://www.derbyastronomy.org/ and http://img3.goodfon.su/.
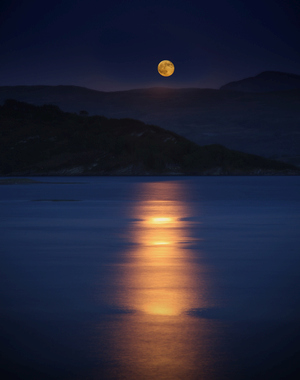
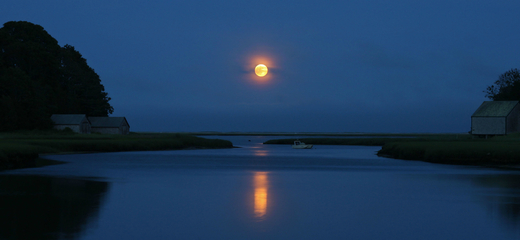
Reflections of the moon in water. To get sufficient details on the reflection, features of the moon should be visible (not overexposed).
In both photos above, the reflection line ends before reaching the horizon, which agrees with the model. Also, areas are visible where the image seems clearer due to less scatter in the direction perpendicular to what is considered here, suggesting lower-amplitude waves - the change in the brightness and spread of the line also suggests the model is at least on the right track. There is evidence of a double image and decrease in brightness with increased wave height in the second photo. Further verification is necessary before claiming that the above model results are accurate (the wave shape seems to be a particularly shaky assumption), but they appear to be a decent first estimate to this involved problem.